Geostat VT RATE
geostat Variable Throw Rate Control 3D
Property Type
geostat
Fault Config
Variable Throw
Well Control
Rate Control
Grid Dimensions
64 x 64 x 32
Train Samples
3200
Val Samples
400
Test Samples
400
Models Evaluated
4
Dataset protocol
Current data provenance for this dataset.
These details come from the Arena protocol metadata and should be updated there when the simulation or preprocessing pipeline changes.
Simulation target
Simulator: OPM Flow
Physics: Two-phase oil-water flow
Reported outputs: Pressure (bar), Water saturation (fraction)
Split and geometry
Split rule: Sequential split by unique grid/property pair; all cases sharing the same grid and property sample stay in the same split.
Fault multipliers: 2 realizations per structural model
Variable-throw cases are mapped from simulator CPG grids to a conformal 32-layer ML grid; static website flow figures show raw simulator targets on the CPG grid.
Results
Loss
9 results
| Sat (frac) | Pres (bar) | |||||||||
|---|---|---|---|---|---|---|---|---|---|---|
| # | Model | Loss | Epochs | rel-L²▲ | MRE | MAE | rel-L² | MRE | MAE | Params |
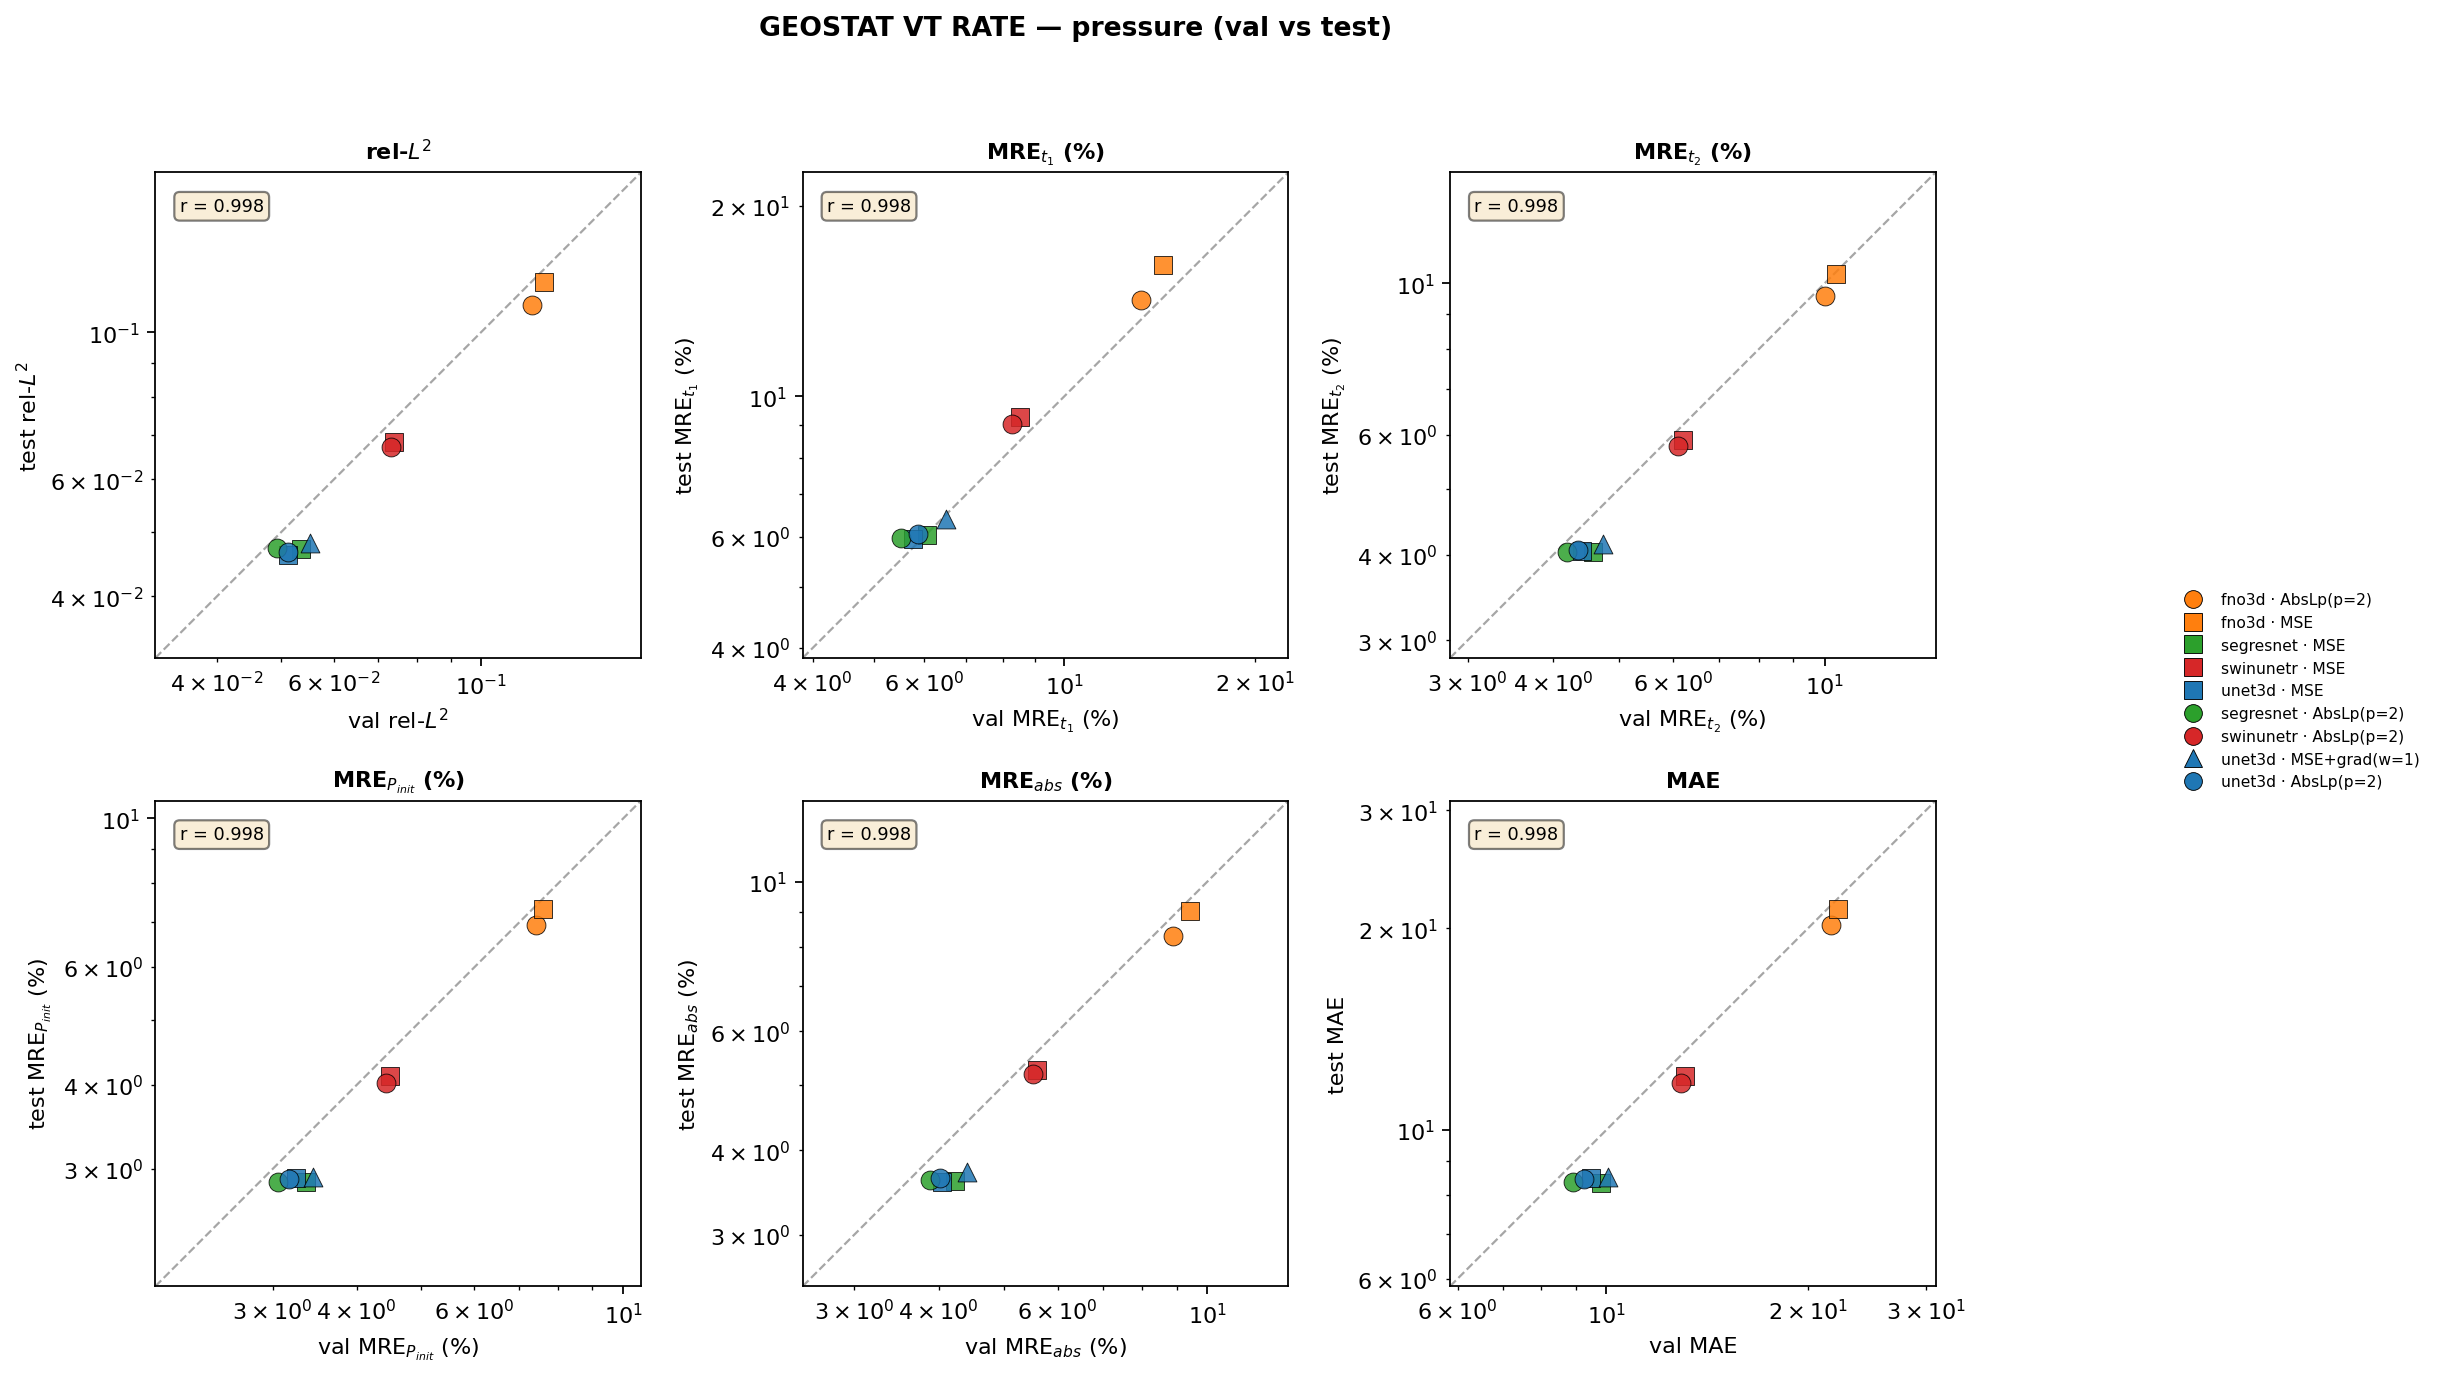
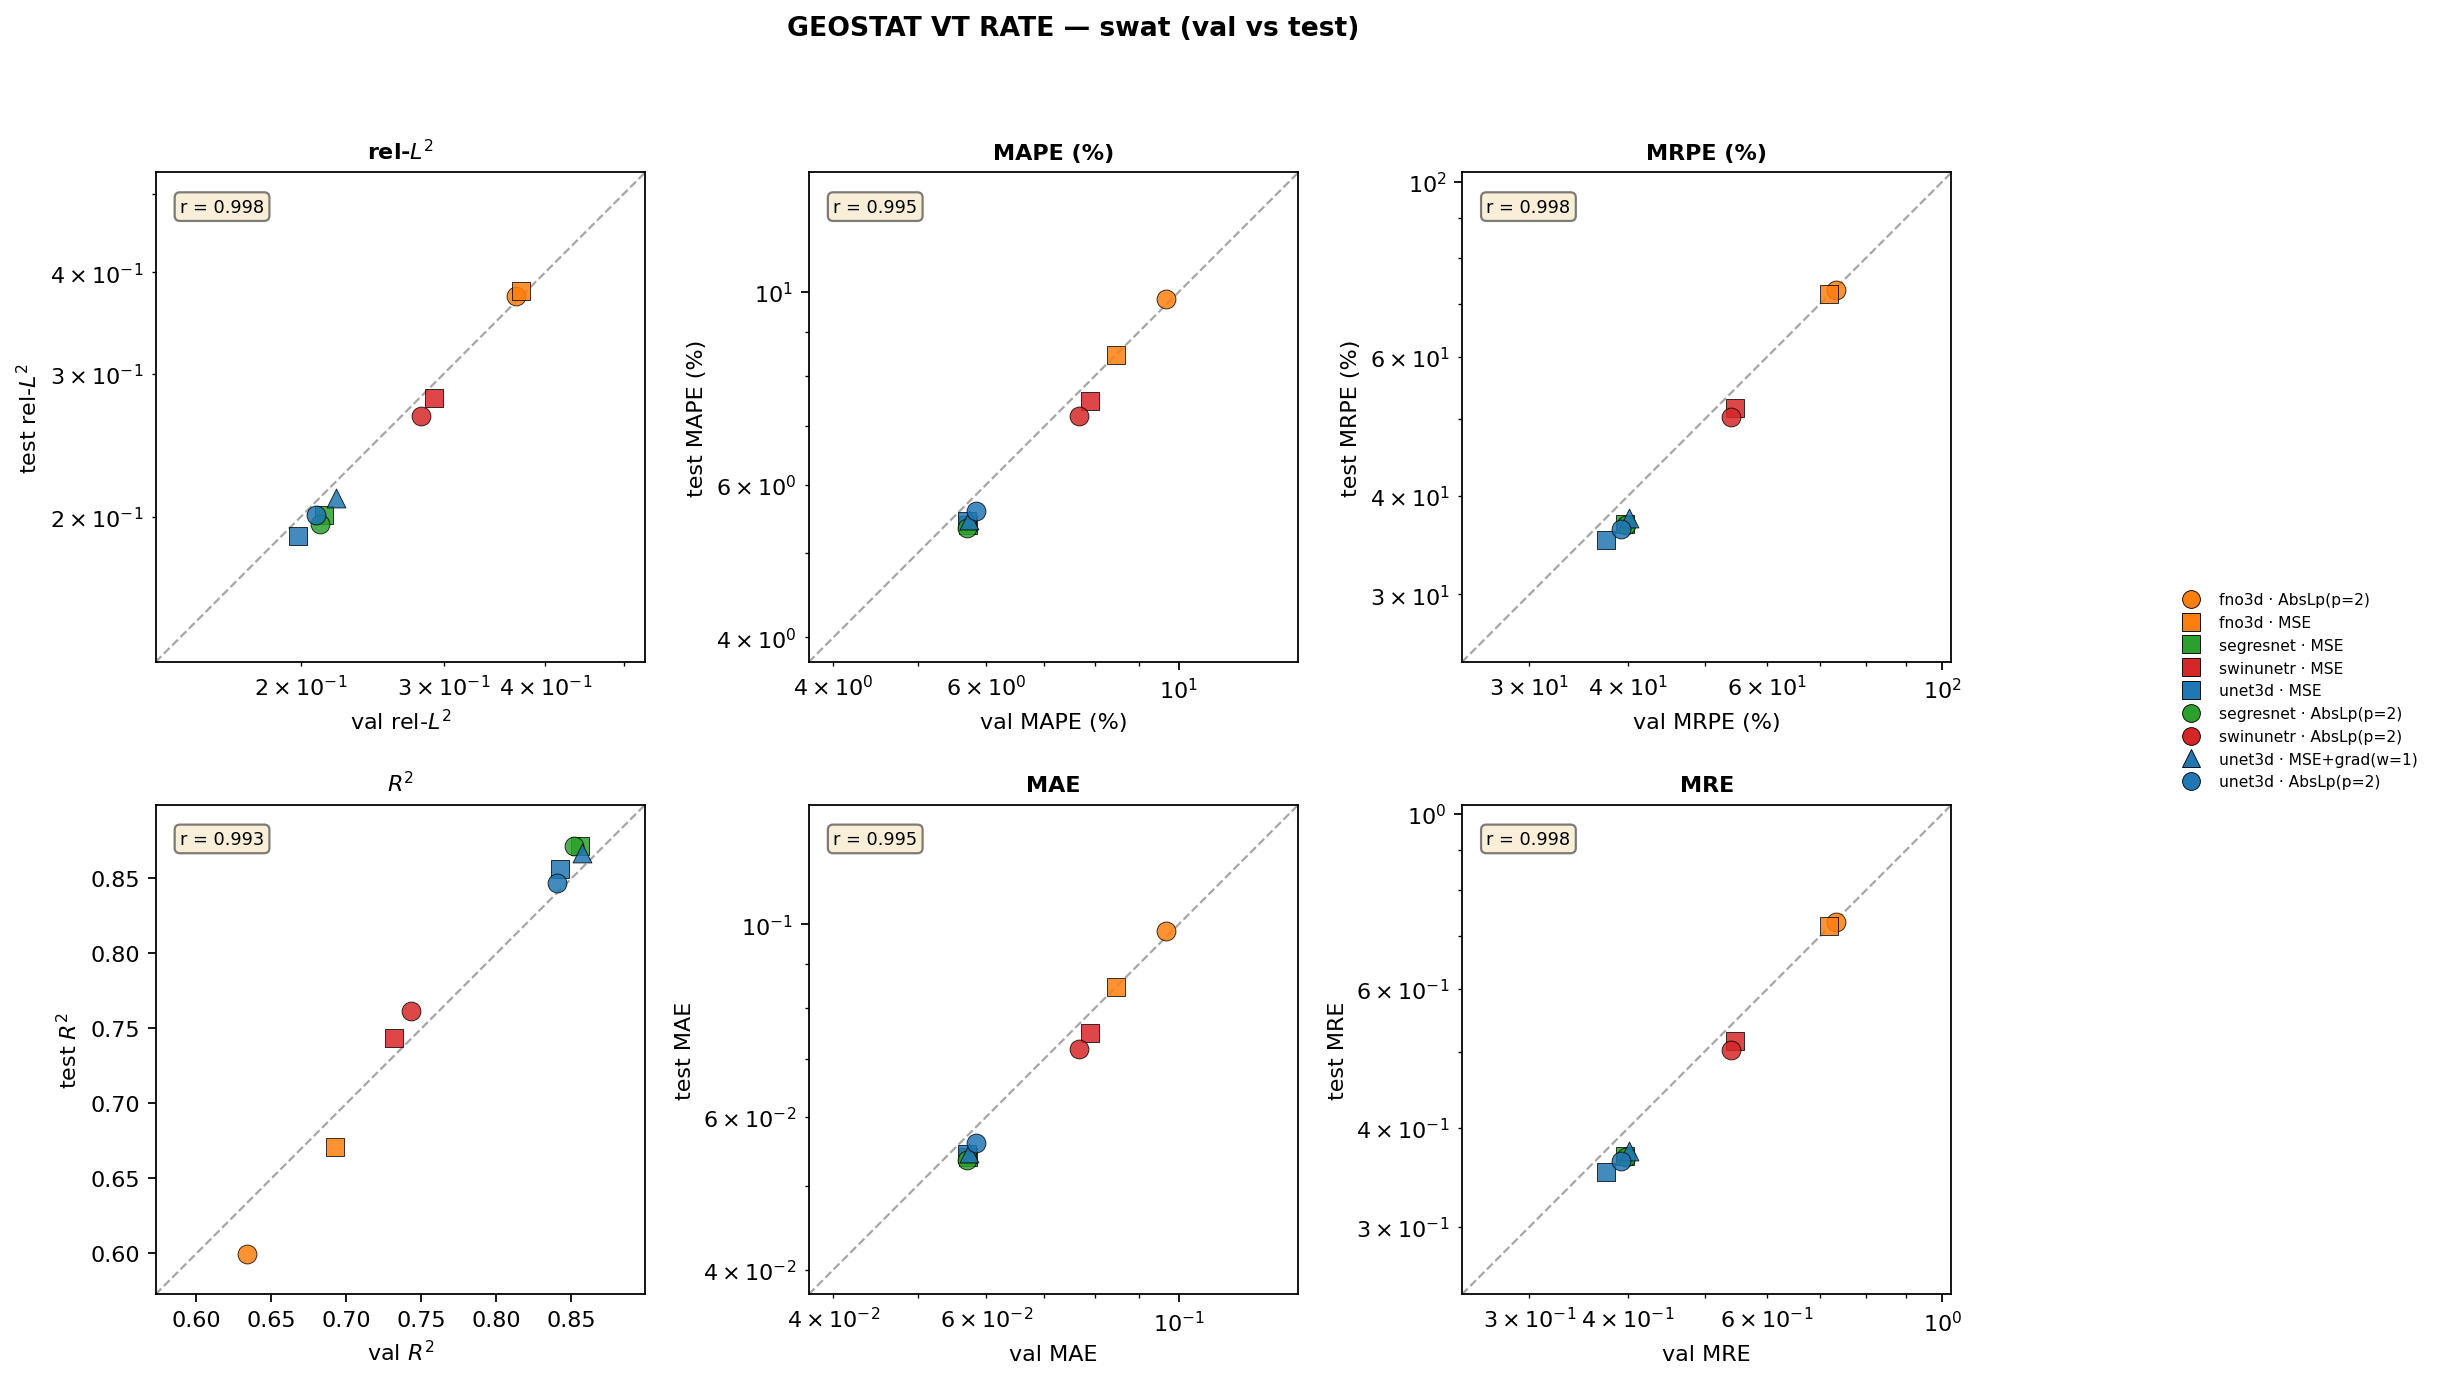
| 1 | UNet3D | MSE | 200 | 0.1894 | 0.3519 | 0.054428 | 0.0461 | 0.0359 | 8.486502 | 35.9M |
| 2 | SegResNet | AbsLp(p=2) | 200 | 0.1963 | 0.3673 | 0.053504 | 0.0473 | 0.0362 | 8.372307 | 29.4M |
| 3 | SegResNet | MSE | 200 | 0.2009 | 0.3689 | 0.053885 | 0.0471 | 0.0361 | 8.347742 | 29.4M |
| 4 | UNet3D | AbsLp(p=2) | 200 | 0.2010 | 0.3629 | 0.055984 | 0.0467 | 0.0364 | 8.458871 | 35.9M |
| 5 | UNet3D | MSE+grad(w=1) | 200 | 0.2109 | 0.3744 | 0.054545 | 0.0481 | 0.0372 | 8.508275 | 35.9M |
| 6 | SwinUNETR | AbsLp(p=2) | 200 | 0.2664 | 0.5028 | 0.071910 | 0.0672 | 0.0519 | 11.766338 | 36.2M |
| 7 | SwinUNETR | MSE | 200 | 0.2802 | 0.5160 | 0.074990 | 0.0684 | 0.0527 | 12.038026 | 36.2M |
| 8 | FNO3D | AbsLp(p=2) | 200 | 0.3744 | 0.7287 | 0.098138 | 0.1098 | 0.0830 | 20.213245 | 35.7M |
| 9 | FNO3D | MSE | 200 | 0.3791 | 0.7203 | 0.084728 | 0.1190 | 0.0903 | 21.365623 | 35.7M |
Metrics Over Time
Water Saturation (SWAT)
Pressure
Validation vs Test
Each point is one run (model × loss variant). Points on the y=x diagonal generalize from val to test consistently; points far above it overfit val. Six panels per field cover rel-L2, MAE, and the four MRE / MAPE variants from the published literature so the choice of denominator is exposed rather than hidden.
Training Configuration
Configuration for the best-performing model (UNet3D).
Training
Epochs200
Learning Rate0.0001
Weight Decay0.001
Max Grad Norm1
Batch Size16
Loss FunctionMSEGradientLoss (gradient_weight=0, dx=50, dy=50, dz=3.6)
SchedulerCosineAnnealingLR (T_max=200, eta_min=0.00001)
Input Features
POROPERMXSWAT_0PRESSURE_0MULTXMULTYDEPTHZ_MLGRID
Output Fields
SWATPRESSURE
Model Architecture
in channels8
out channels40
base channels42
kernel size3
depth3
num time steps1
squashed outputfalse
flatten outputtrue