Industrial benchmark asset

Private data, public evidence.

Flow Arena is the proprietary benchmark layer of this portal. The raw simulation tensors remain private, while the benchmark design, evaluation protocol, aggregate metrics, and model standings are published for scrutiny.

The suite was built to test where surrogate reservoir models break: high-contrast channels, fault transmissibility barriers, variable-throw geometry, and operational control changes. Reference academic benchmarks validate the pipeline; Flow Arena measures industrial robustness.

Benchmark design

Dataset axes

Flow Arena comprises 12 datasets formed by the Cartesian product of three axes: property type (Channels, Geostat), fault configuration (No Fault, Zero Throw, Variable Throw), and well control (BHP, Rate).

Throw is the vertical offset between rock layers across a fault plane. No Fault has none; Zero Throw faults perturb only the transmissibility between adjacent cells (no grid distortion); Variable Throw faults add irregular vertical displacement and the resulting grid geometry changes.

Simulations are two-phase oil-water flow run in OPM Flow over 20 reporting steps. Dataset size scales with geological complexity: 1,000 No Fault cases, 2,000 Zero Throw, 4,000 Variable Throw — each faulted structural model also includes 2 random fault-transmissibility multiplier realizations on the same grid.

Protocol status

Stable design, evolving implementation.

The benchmark axes are stable, but simulation schedules, preprocessing details, training recipes, and published results can change as the dataset and models are refined.

The website reads the current simulator protocol from Arena metadata synced from the data pipeline. When the pipeline changes, update the protocol metadata and regenerate the website data instead of editing page copy in multiple places.

How to read Flow Arena

Start at the leaderboard, finish at the matrix.

Compare within a dataset

Each dataset fixes property family, fault mode, and well control. Rank models there first before averaging across the full matrix.

Separate pressure from SWAT

Pressure and saturation errors are reported separately because a model can preserve pressure support while smearing the water front.

Look for robustness

A single win is less informative than stable rank across channels, geostatistical fields, zero-throw faults, variable-throw faults, BHP, and rate control.

Controlled design matrix

2 property types x 3 fault regimes x 2 controls

Private tensors 3D 20 timesteps

Channels

High-contrast facies fields that create sharper permeability transitions and saturation fronts.

No Fault

Baseline 8-layer geometry without fault barriers.

2 control datasets
2000 total cases
Best observed: UNet3D
Zero Throw

Fault transmissibility heterogeneity without vertical displacement.

2 control datasets
4000 total cases
2 multiplier realizations
Best observed: UNet3D
Variable Throw

Variable-throw faulted geometry with 32 ML-grid layers and irregular vertical structure.

2 control datasets
8000 total cases
2 multiplier realizations
Best observed: UNet3D

Geostat

Continuous geostatistical property fields that test smooth heterogeneity and broad pressure response.

No Fault

Baseline 8-layer geometry without fault barriers.

2 control datasets
2000 total cases
Best observed: UNet3D
Zero Throw

Fault transmissibility heterogeneity without vertical displacement.

2 control datasets
4000 total cases
2 multiplier realizations
Best observed: UNet3D
Variable Throw

Variable-throw faulted geometry with 32 ML-grid layers and irregular vertical structure.

2 control datasets
8000 total cases
2 multiplier realizations
Best observed: UNet3D
3D benchmark views

Representative Flow Arena geology.

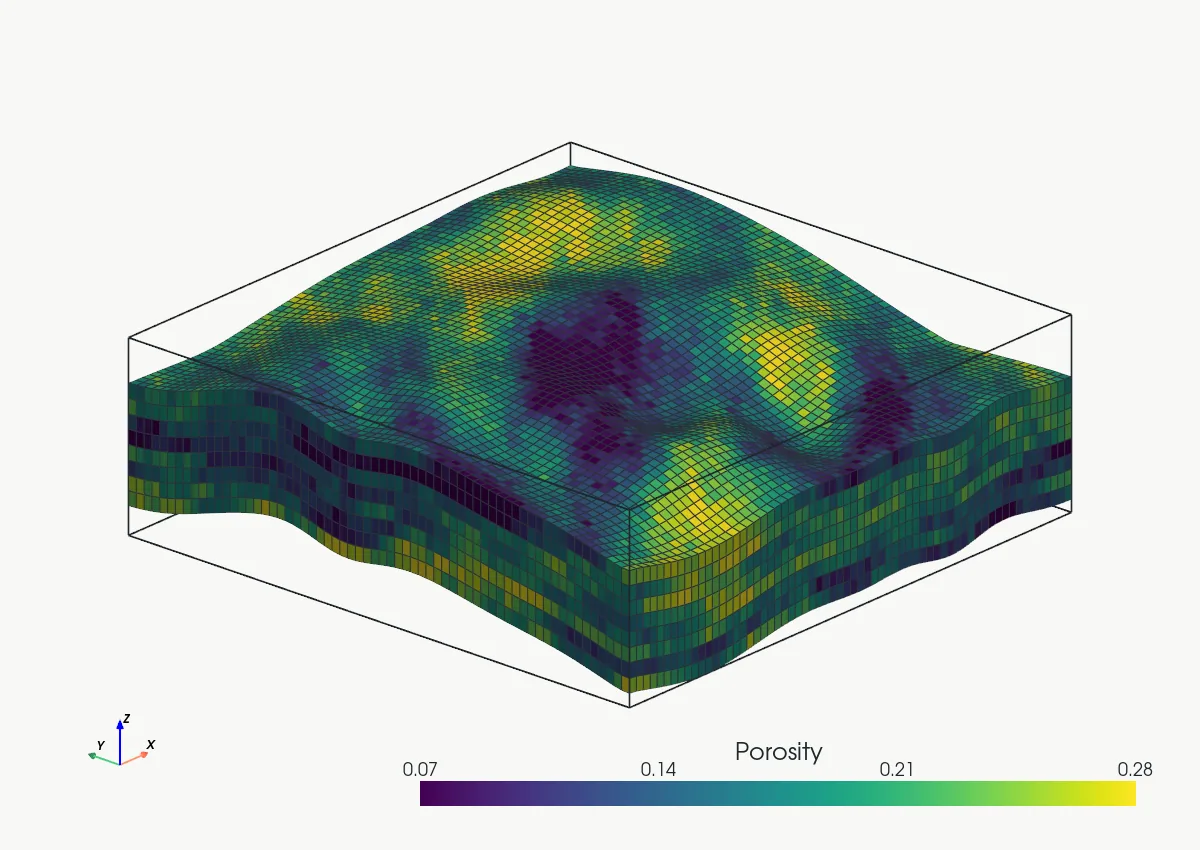
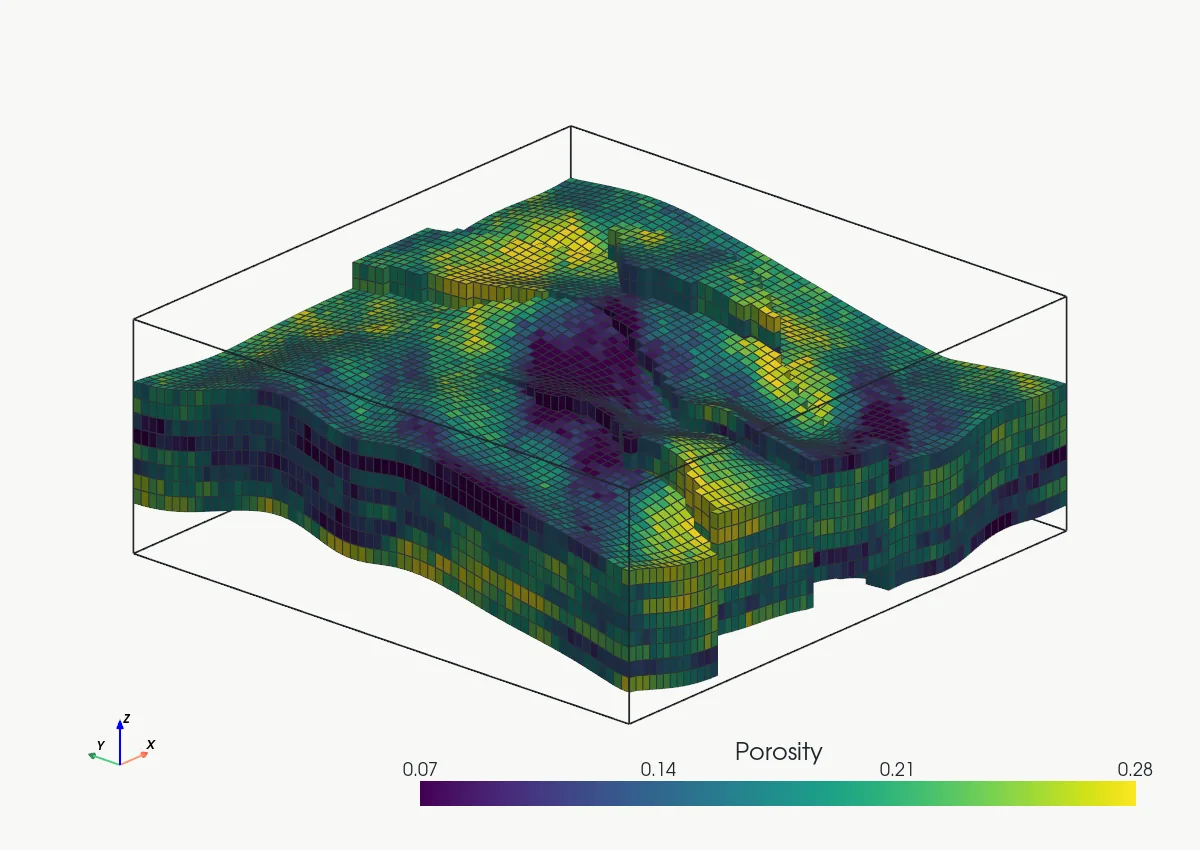
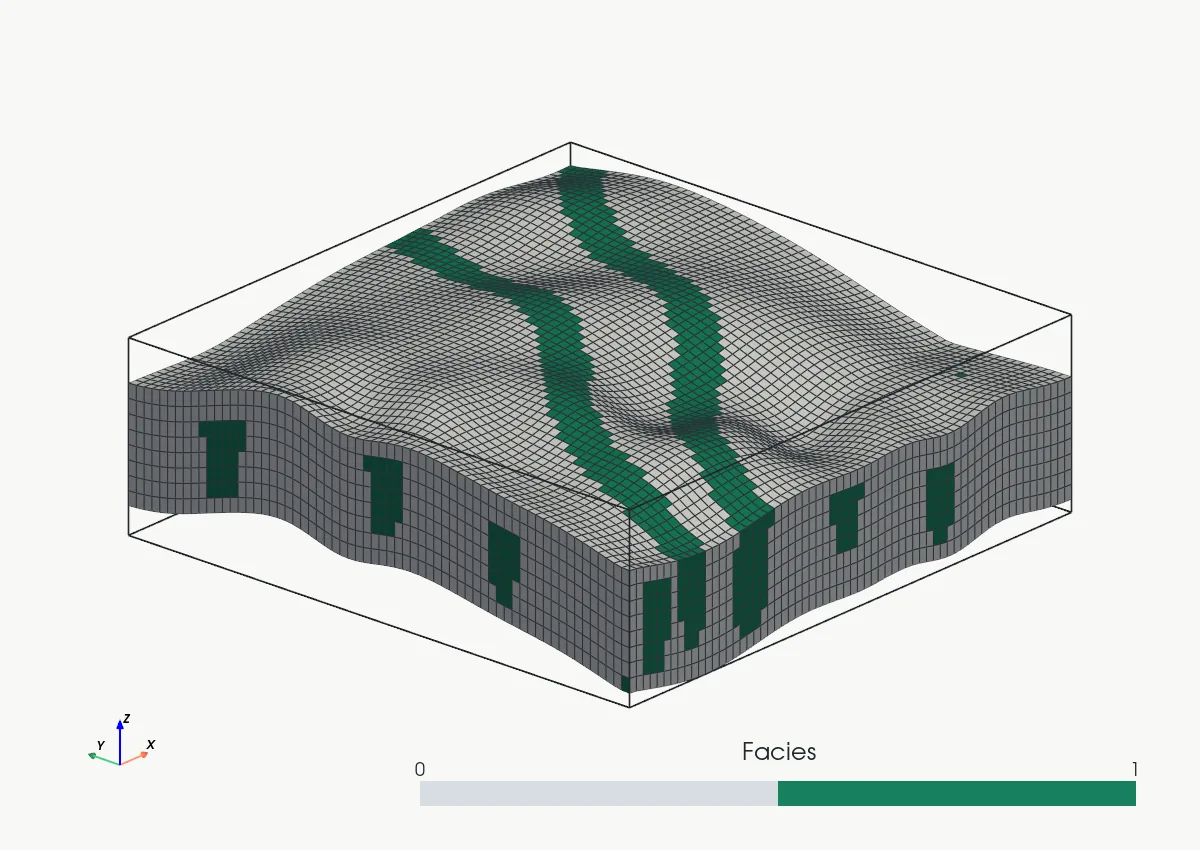
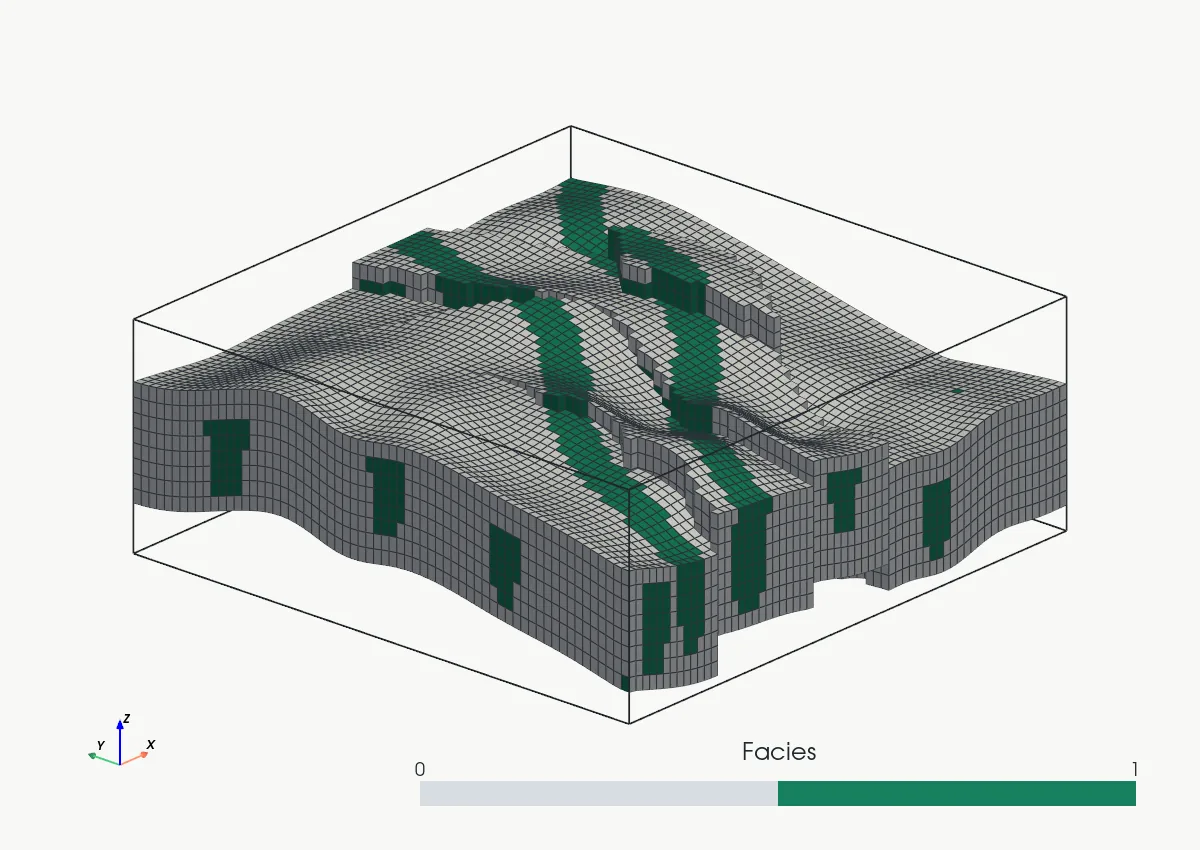
Static 3D renders show the same realization under no-fault and variable-throw geometries. Zero-throw cases use the same fault locations as VT, but their visible grid geometry is close to NF, so the portal shows NF and VT as the clearest geometry contrast.

Static 3D exports

Geostat

NF Geostat static 3D render
NF Geostat
No-fault geometry
VT Geostat static 3D render
VT Geostat
Variable-throw faults

Channels

NF Channels static 3D render
NF Channels
No-fault geometry
VT Channels static 3D render
VT Channels
Variable-throw faults

Generated from Flow Arena grids with representative geostatistical porosity and channel facies arrays. Vertical scale is exaggerated 10x for visual inspection.

VT flow evolution

Pressure and saturation through time.

A Channels VT case shows raw OPM Flow training-data targets on the simulator CPG grid for two fault-transmissibility multiplier realizations. No model prediction is shown. The panels use the same 3D camera and vertical scale as the geology views, with pressure on the first row and SWAT on the second row.
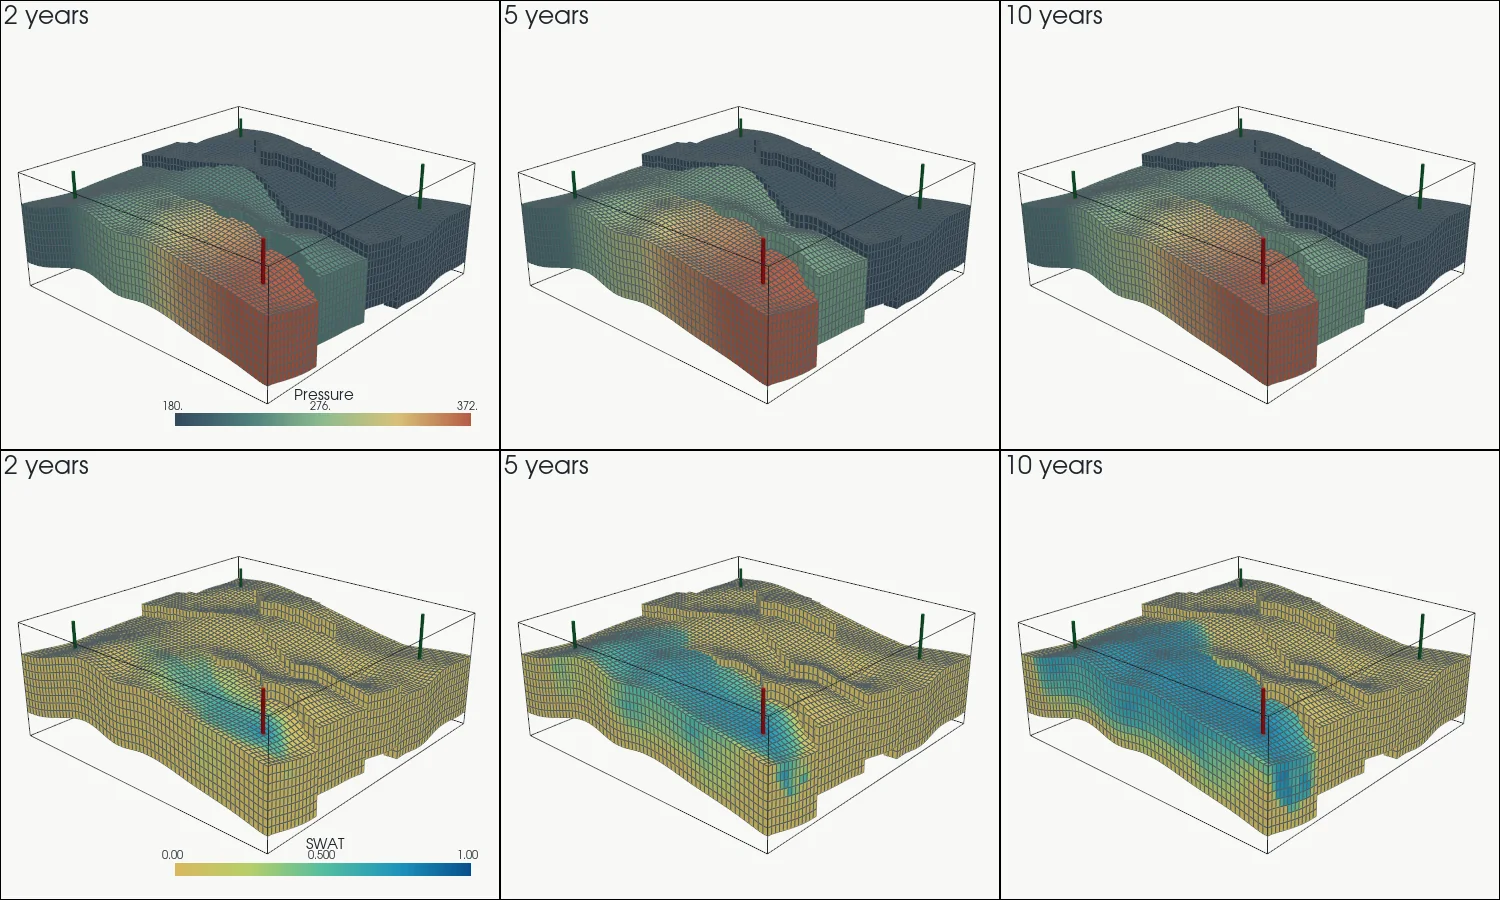
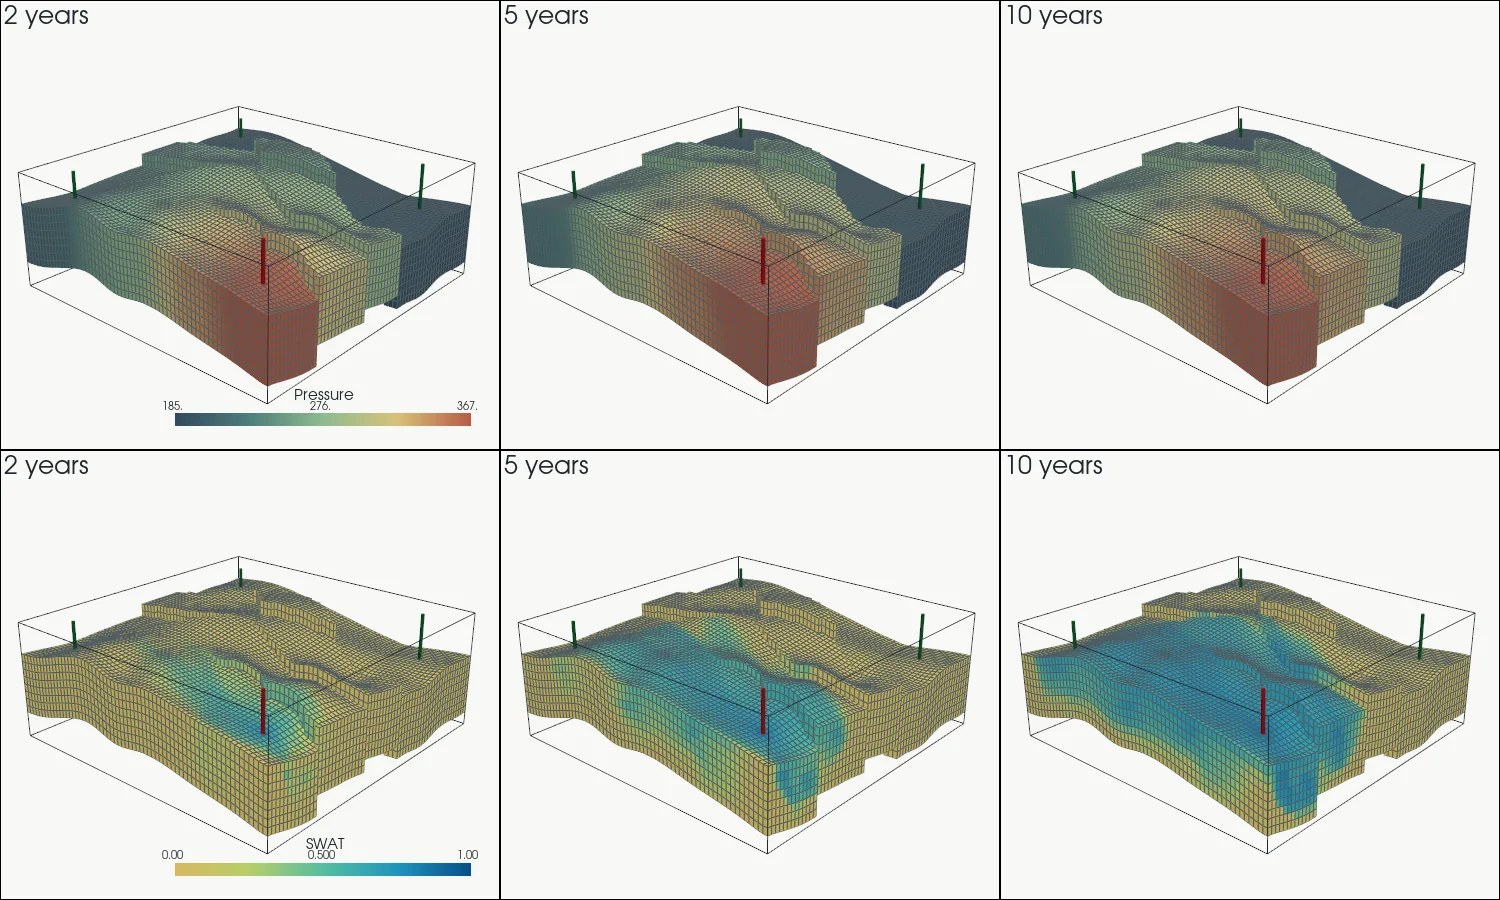
2, 5, 10 years
Channels VT training-data evolution, M000: pressure and water saturation evolution at 2, 5, and 10 years
Channels VT training-data evolution, M000
Raw OPM Flow pressure and water saturation training targets on the simulator CPG grid at 2, 5, and 10 years, using fault-transmissibility multiplier realization M000.
Channels VT training-data evolution, M001: pressure and water saturation evolution at 2, 5, and 10 years
Channels VT training-data evolution, M001
Raw OPM Flow pressure and water saturation training targets on the simulator CPG grid at 2, 5, and 10 years, using fault-transmissibility multiplier realization M001.
Robustness summary

Grouped error reveals what each axis costs.

These summaries average overall rel-L² across all current model runs in each slice. Lower is better; use them as a directional difficulty map, not a replacement for per-model leaderboards.

Property type

avg rel-L²
Channels0.0620
6 datasets, 50 runs
Geostat0.0483
6 datasets, 50 runs

Fault regime

avg rel-L²
No Fault0.0408
4 datasets, 32 runs
Zero Throw0.0610
4 datasets, 32 runs
Variable Throw0.0626
4 datasets, 36 runs

Well control

avg rel-L²
BHP0.0449
6 datasets, 50 runs
Rate0.0654
6 datasets, 50 runs
Model x dataset matrix

Where each architecture wins and slips.

Each cell ranks a model within one Flow Arena dataset by overall rel-L². This makes robustness visible without over-weighting runtime.

Model
BHP
Channels NF
RATE
Channels NF
BHP
Channels ZT
RATE
Channels ZT
BHP
Channels VT
RATE
Channels VT
BHP
Geostat NF
RATE
Geostat NF
BHP
Geostat ZT
RATE
Geostat ZT
BHP
Geostat VT
RATE
Geostat VT
UNet3D
#1
0.0266
#1
0.0437
#1
0.0319
#1
0.0537
#1
0.0344
#1
0.0540
#1
0.0219
#1
0.0302
#1
0.0307
#1
0.0456
#1
0.0295
#1
0.0461
SegResNet
#2
0.0307
#2
0.0460
#2
0.0372
#2
0.0589
#2
0.0367
#2
0.0564
#2
0.0247
#2
0.0310
#2
0.0318
#2
0.0496
#2
0.0302
#2
0.0471
SwinUNETR
#3
0.0416
#3
0.0529
#3
0.0574
#3
0.0857
#3
0.0586
#3
0.0841
#3
0.0322
#3
0.0370
#3
0.0481
#3
0.0684
#3
0.0458
#3
0.0672
FNO3D
#4
0.0630
#4
0.0766
#4
0.0856
#4
0.1227
#4
0.1008
#4
0.1458
#4
0.0371
#4
0.0422
#4
0.0604
#4
0.0993
#4
0.0778
#4
0.1098
#1 best rel-L² for that datasetCells show rank and rel-L²
Per-field rel-L2

Best result per cell across all loss variants.

Each cell shows the minimum test rel-L2 achieved by a model on that dataset over every evaluated loss configuration, with rank in each column. Lower is better.

Pressure

Model
BHP
Channels NF
RATE
Channels NF
BHP
Channels ZT
RATE
Channels ZT
BHP
Channels VT
RATE
Channels VT
BHP
Geostat NF
RATE
Geostat NF
BHP
Geostat ZT
RATE
Geostat ZT
BHP
Geostat VT
RATE
Geostat VT
UNet3D
#1
0.0266
#1
0.0437
#1
0.0319
#1
0.0537
#1
0.0344
#1
0.0540
#1
0.0219
#1
0.0302
#1
0.0307
#1
0.0456
#1
0.0295
#1
0.0461
SegResNet
#2
0.0307
#2
0.0460
#2
0.0372
#2
0.0589
#2
0.0367
#2
0.0564
#2
0.0247
#2
0.0310
#2
0.0318
#2
0.0496
#2
0.0302
#2
0.0471
SwinUNETR
#3
0.0416
#3
0.0529
#3
0.0574
#3
0.0857
#3
0.0586
#3
0.0841
#3
0.0322
#3
0.0370
#3
0.0481
#3
0.0684
#3
0.0458
#3
0.0672
FNO3D
#4
0.0630
#4
0.0766
#4
0.0856
#4
0.1227
#4
0.1008
#4
0.1458
#4
0.0371
#4
0.0422
#4
0.0604
#4
0.0993
#4
0.0778
#4
0.1098
#1 best rel-L² for that datasetCells show rank and rel-L²

SWAT

Model
BHP
Channels NF
RATE
Channels NF
BHP
Channels ZT
RATE
Channels ZT
BHP
Channels VT
RATE
Channels VT
BHP
Geostat NF
RATE
Geostat NF
BHP
Geostat ZT
RATE
Geostat ZT
BHP
Geostat VT
RATE
Geostat VT
UNet3D
#1
0.1722
#1
0.2089
#1
0.2230
#1
0.2457
#1
0.2384
#1
0.2574
#1
0.1470
#1
0.1436
#1
0.1894
#1
0.1848
#1
0.1942
#1
0.1894
SegResNet
#2
0.1940
#2
0.2197
#2
0.2519
#2
0.2712
#2
0.2595
#2
0.2661
#2
0.1512
#2
0.1505
#2
0.1958
#2
0.1913
#2
0.1987
#2
0.1963
SwinUNETR
#3
0.2589
#3
0.2858
#3
0.3605
#3
0.3685
#3
0.3575
#3
0.3670
#3
0.1882
#3
0.1881
#3
0.2710
#3
0.2521
#3
0.2749
#3
0.2664
FNO3D
#4
0.3062
#4
0.3508
#4
0.4080
#4
0.4301
#4
0.4708
#4
0.4823
#4
0.2207
#4
0.2176
#4
0.3079
#4
0.3215
#4
0.3630
#4
0.3744
#1 best rel-L² for that datasetCells show rank and rel-L²
Per loss variant

Isolating one loss configuration at a time exposes the cost of switching loss directly.

AbsLp(p=2)
abslp_p2
Pressure
Model
BHP
Channels NF
RATE
Channels NF
BHP
Channels ZT
RATE
Channels ZT
BHP
Channels VT
RATE
Channels VT
BHP
Geostat NF
RATE
Geostat NF
BHP
Geostat ZT
RATE
Geostat ZT
BHP
Geostat VT
RATE
Geostat VT
UNet3D
#1
0.0267
#1
0.0449
#1
0.0323
#1
0.0537
#1
0.0354
#2
0.0564
#1
0.0219
#1
0.0302
#1
0.0307
#1
0.0456
#2
0.0303
#1
0.0467
SegResNet
#2
0.0307
#2
0.0473
#2
0.0372
#2
0.0589
#2
0.0373
#1
0.0564
#2
0.0247
#2
0.0310
#2
0.0318
#2
0.0500
#1
0.0302
#2
0.0473
SwinUNETR
#3
0.0416
#3
0.0529
#3
0.0574
#3
0.0857
#3
0.0586
#3
0.0841
#3
0.0322
#3
0.0370
#3
0.0481
#3
0.0684
#3
0.0458
#3
0.0672
FNO3D
#4
0.0630
#4
0.0766
#4
0.0860
#4
0.1227
#4
0.1008
#4
0.1458
#4
0.0371
#4
0.0422
#4
0.0604
#4
0.0993
#4
0.0778
#4
0.1098
#1 best rel-L² for that datasetCells show rank and rel-L²
SWAT
Model
BHP
Channels NF
RATE
Channels NF
BHP
Channels ZT
RATE
Channels ZT
BHP
Channels VT
RATE
Channels VT
BHP
Geostat NF
RATE
Geostat NF
BHP
Geostat ZT
RATE
Geostat ZT
BHP
Geostat VT
RATE
Geostat VT
UNet3D
#1
0.1722
#1
0.2104
#1
0.2232
#1
0.2457
#1
0.2506
#2
0.2665
#1
0.1470
#1
0.1436
#1
0.1901
#1
0.1848
#2
0.2022
#2
0.2010
SegResNet
#2
0.1940
#2
0.2197
#2
0.2519
#2
0.2712
#2
0.2614
#1
0.2661
#2
0.1512
#2
0.1505
#2
0.1958
#2
0.1913
#1
0.1987
#1
0.1963
SwinUNETR
#3
0.2589
#3
0.2858
#3
0.3605
#3
0.3758
#3
0.3575
#3
0.3670
#3
0.1882
#3
0.1881
#3
0.2710
#3
0.2521
#3
0.2749
#3
0.2664
FNO3D
#4
0.3062
#4
0.3508
#4
0.4080
#4
0.4328
#4
0.4708
#4
0.4823
#4
0.2207
#4
0.2176
#4
0.3079
#4
0.3224
#4
0.3636
#4
0.3744
#1 best rel-L² for that datasetCells show rank and rel-L²
MSE
mse
Pressure
Model
BHP
Channels NF
RATE
Channels NF
BHP
Channels ZT
RATE
Channels ZT
BHP
Channels VT
RATE
Channels VT
BHP
Geostat NF
RATE
Geostat NF
BHP
Geostat ZT
RATE
Geostat ZT
BHP
Geostat VT
RATE
Geostat VT
UNet3D
#1
0.0266
#1
0.0437
#1
0.0319
#1
0.0549
#1
0.0344
#1
0.0552
#1
0.0228
#1
0.0313
#1
0.0307
#1
0.0469
#1
0.0295
#1
0.0461
SegResNet
#2
0.0324
#2
0.0460
#2
0.0391
#2
0.0608
#2
0.0367
#2
0.0575
#2
0.0259
#2
0.0333
#2
0.0327
#2
0.0496
#2
0.0305
#2
0.0471
SwinUNETR
#3
0.0452
#3
0.0553
#3
0.0581
#3
0.0872
#3
0.0594
#3
0.0881
#3
0.0332
#3
0.0414
#3
0.0485
#3
0.0721
#3
0.0473
#3
0.0684
FNO3D
#4
0.0630
#4
0.0801
#4
0.0856
#4
0.1241
#4
0.1039
#4
0.1505
#4
0.0392
#4
0.0472
#4
0.0616
#4
0.0999
#4
0.0810
#4
0.1190
#1 best rel-L² for that datasetCells show rank and rel-L²
SWAT
Model
BHP
Channels NF
RATE
Channels NF
BHP
Channels ZT
RATE
Channels ZT
BHP
Channels VT
RATE
Channels VT
BHP
Geostat NF
RATE
Geostat NF
BHP
Geostat ZT
RATE
Geostat ZT
BHP
Geostat VT
RATE
Geostat VT
UNet3D
#1
0.1766
#1
0.2089
#1
0.2230
#1
0.2457
#1
0.2384
#1
0.2596
#1
0.1478
#1
0.1555
#1
0.1894
#1
0.1854
#1
0.1942
#1
0.1894
SegResNet
#2
0.2043
#2
0.2291
#2
0.2599
#2
0.2750
#2
0.2595
#2
0.2715
#2
0.1644
#2
0.1625
#2
0.2010
#2
0.1946
#2
0.2037
#2
0.2009
SwinUNETR
#3
0.2712
#3
0.2944
#3
0.3607
#3
0.3685
#3
0.3653
#3
0.3763
#3
0.2008
#3
0.2012
#3
0.2750
#3
0.2601
#3
0.2809
#3
0.2802
FNO3D
#4
0.3125
#4
0.3562
#4
0.4119
#4
0.4301
#4
0.4785
#4
0.4886
#4
0.2345
#4
0.2413
#4
0.3101
#4
0.3215
#4
0.3630
#4
0.3791
#1 best rel-L² for that datasetCells show rank and rel-L²
Metric guide

What the reported errors mean.

rel-L2
Primary ranking metric. It compares the full predicted field with the simulator target and normalizes by the simulator field magnitude.
Pressure
Total pressure in bar. Errors indicate whether the surrogate preserves pressure support, depletion, and fault-driven connectivity effects.
SWAT
Water saturation as a fraction. Errors expose front placement, breakthrough timing, and whether channel or fault pathways are blurred.
Per-timestep
The same metrics are tracked through time so late-time drift and transient failures are visible instead of hidden in one aggregate number.
Model robustness

Wins matter, but worst-case behavior matters more.

Flow Arena ranks architectures across all 12 private datasets, exposing whether a model is consistently strong or only wins narrow cases.

UNet3D
Avg rank
1.0
Wins
12/12
Top 2
12/12
SegResNet
Avg rank
2.0
Wins
0/12
Top 2
12/12
SwinUNETR
Avg rank
3.0
Wins
0/12
Top 2
0/12
FNO3D
Avg rank
4.0
Wins
0/12
Top 2
0/12
Evaluation protocol

What is public, what is restricted, and how access works.

Published

  • Benchmark axes, grid dimensions, fields, and sample counts
  • Held-out test metrics, per-field errors, and per-timestep trends
  • Model parameters and training configuration
  • Aggregate rankings and production-ready comparison tables

Restricted

  • Raw simulation tensors and full geological realizations
  • Complete private train, validation, and test case files
  • High-resolution internal exports used for model development
  • Access to private data or hosted evaluation by agreement

Evaluation workflow

  • Submit a trained model or run an agreed hosted evaluation
  • Receive per-dataset, per-field, and per-timestep reports
  • Decide which aggregate results can be published
  • Use the same protocol for internal model selection

Channels

Geostatistical