CO2 Radial
2D CO2-water multiphase flow benchmark for carbon capture and storage. Radial-symmetric domain (96x200 grid) with 24 prediction timesteps.
CO2 radial saturation case study
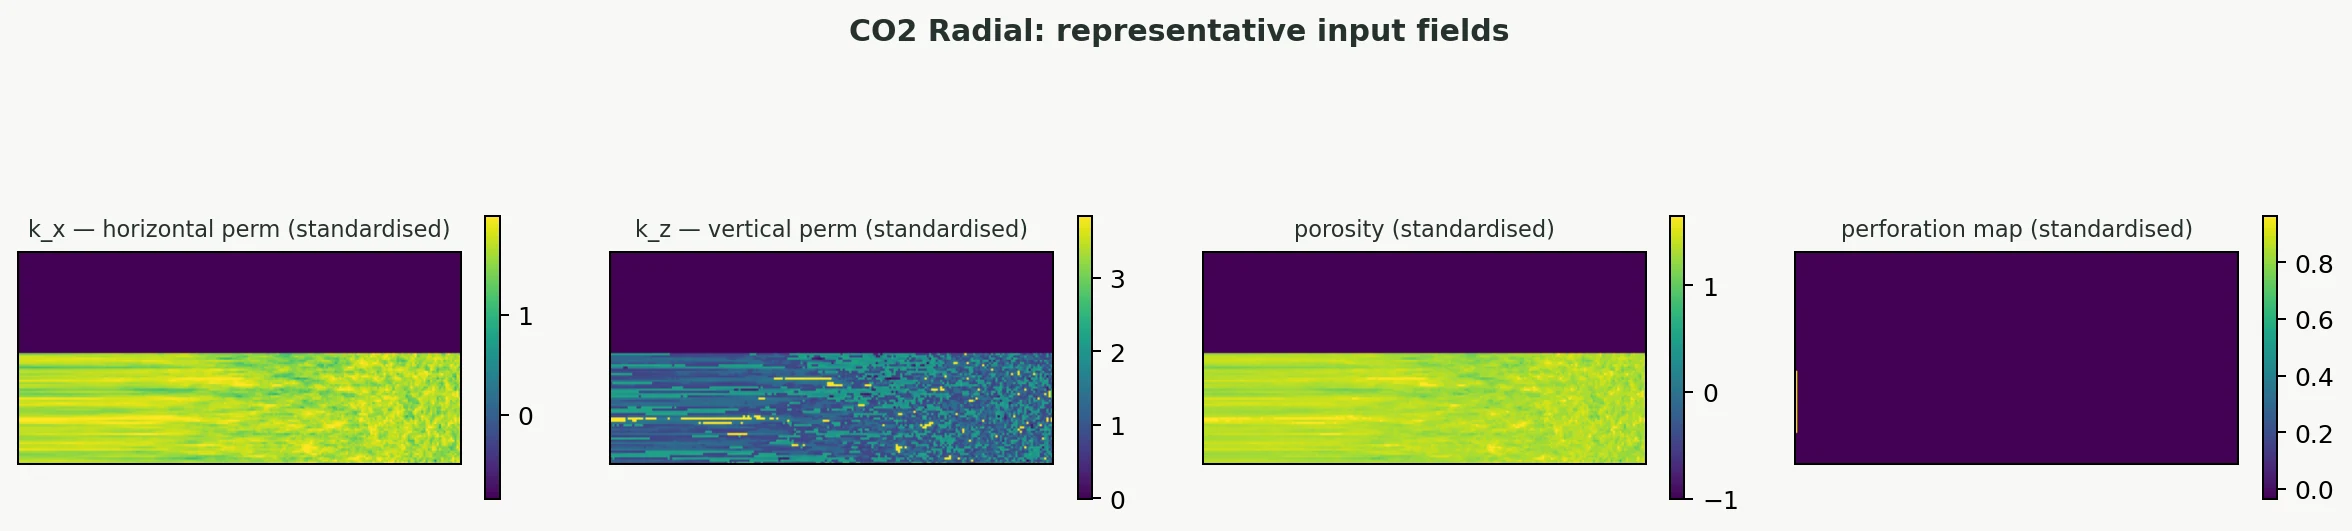
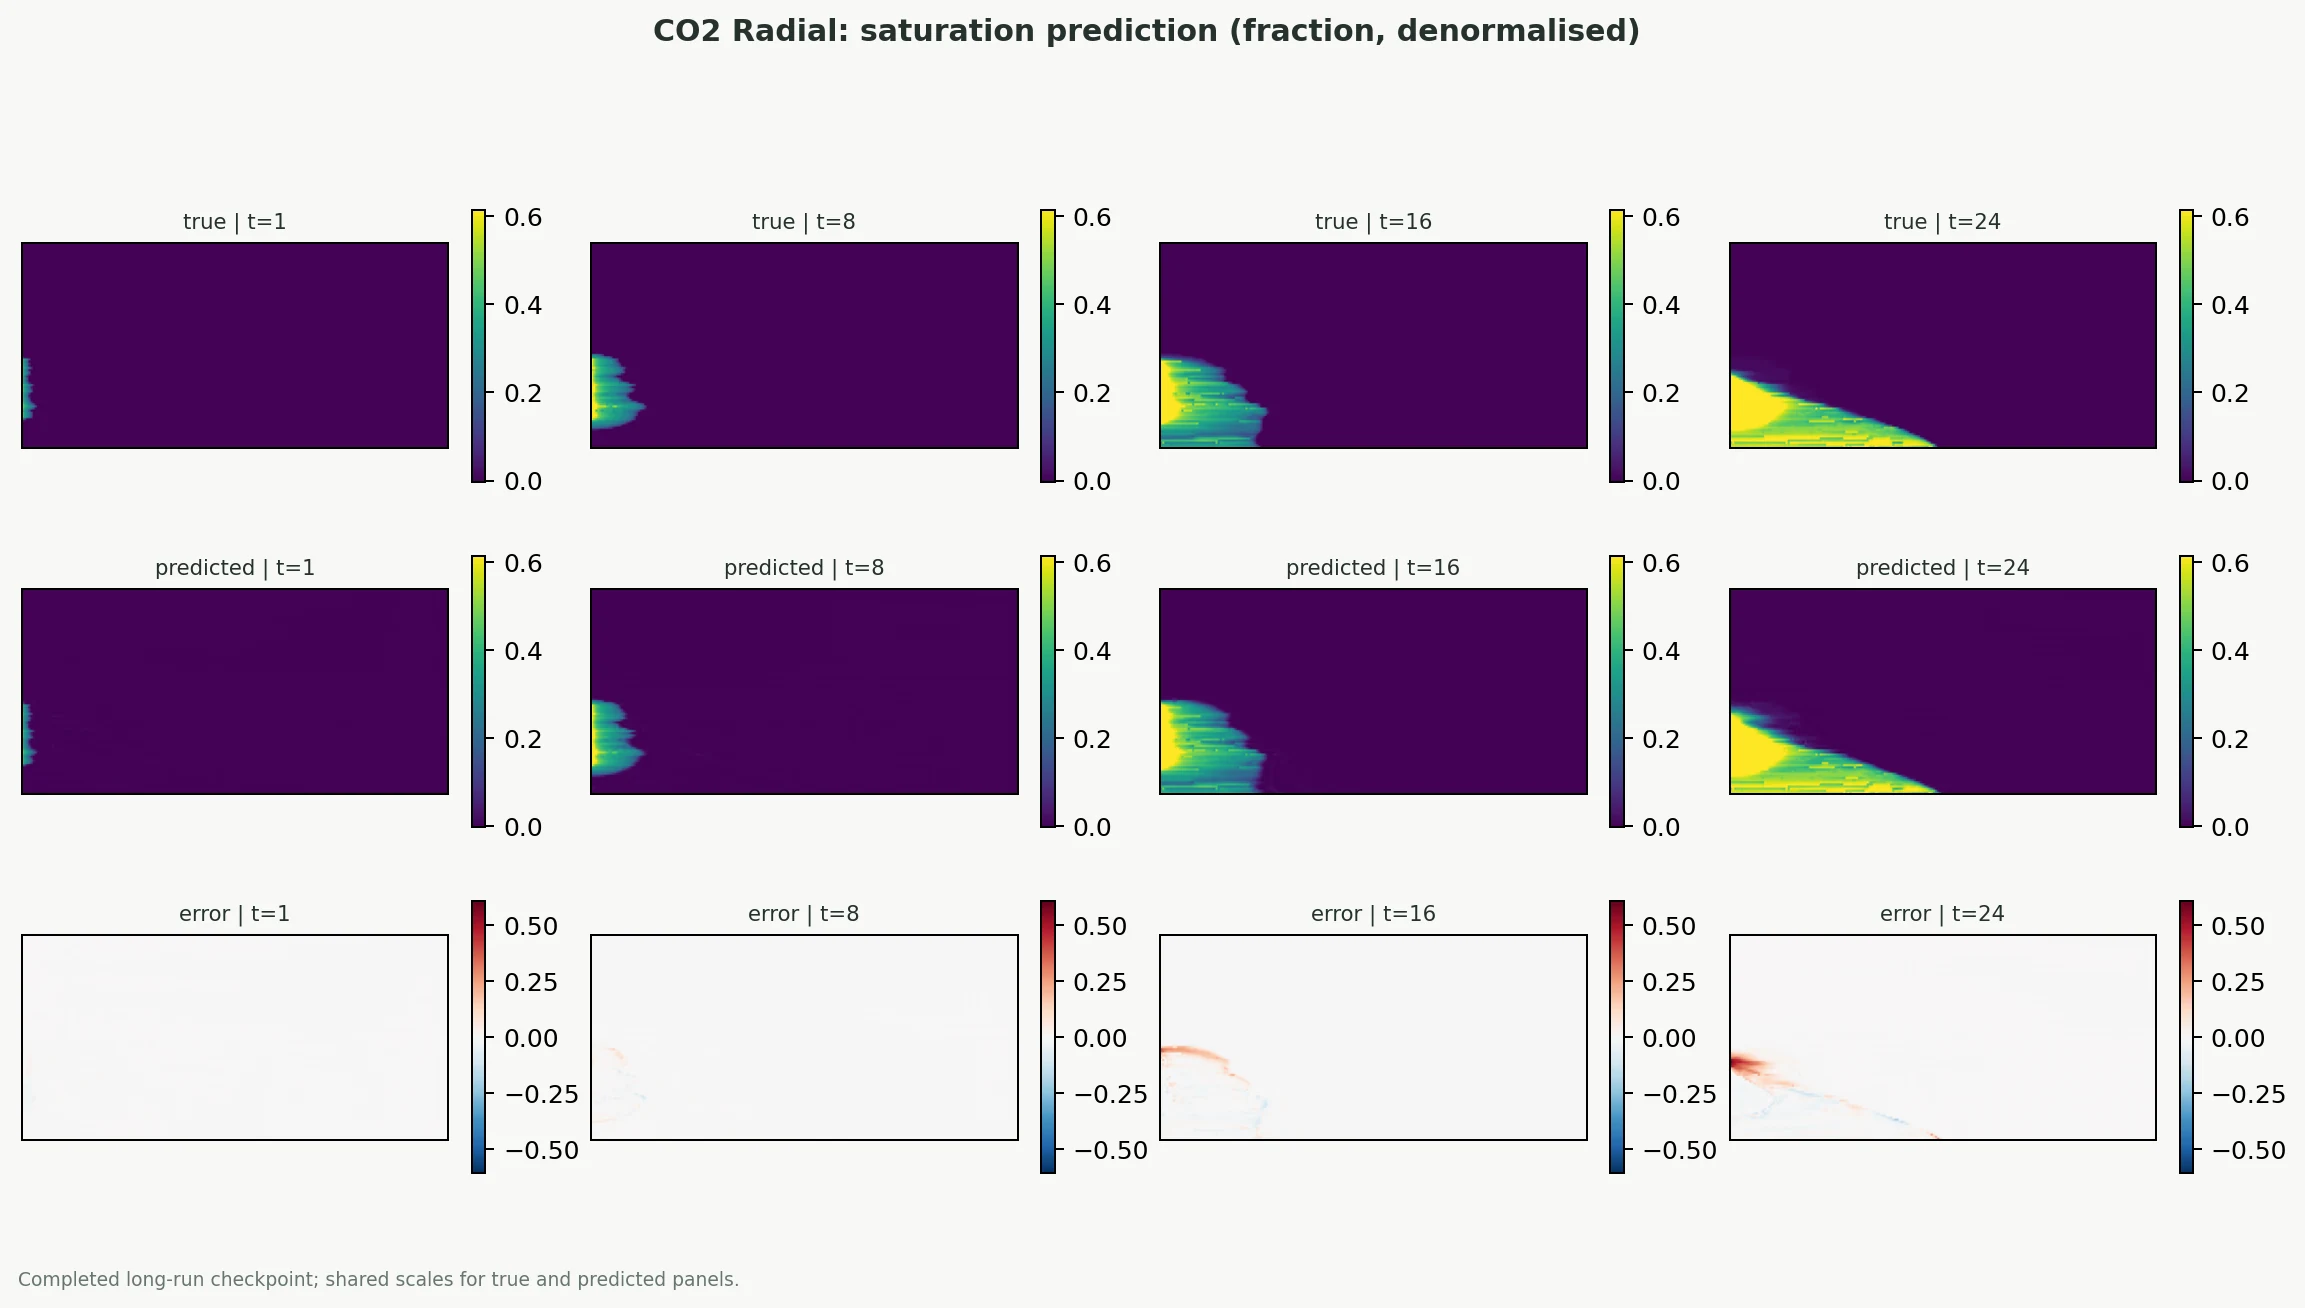
Static figures from a completed long-run. The panels show the model input context, including initial-state fields, plus the true gas saturation, the prediction, and the signed error at selected timesteps for a held-out case.
Representative held-out case
Leaderboard
| Pres (bar) | Sat (frac) | ||||||||||
|---|---|---|---|---|---|---|---|---|---|---|---|
| # | Target | Model | Loss | Epochs | rel-L²▲ | MRE | MAE | rel-L² | MRE | MAE | Params |
| 1 | pressure | UNet3D | UFNODerivLoss | 500 | 0.0030 | 0.0008 | 0.181463 | - | - | - | 20.8M |
| 2 | pressure | UNet2D | RelLp | 500 | 0.0031 | 0.0008 | 0.193750 | - | - | - | 16.3M |
| 3 | pressure | SegResNet2D | RelLp | 500 | 0.0032 | 0.0009 | 0.200384 | - | - | - | 14.2M |
| 4 | pressure | UNet2D | RelLp | 500 | 0.0032 | 0.0010 | 0.217995 | - | - | - | 29.0M |
| 5 | combined | UNet2D | RelLp | 500 | 0.0034 | 0.0010 | 0.232792 | 0.0708 | 5.9654 | 0.001713 | 16.3M |
| 6 | pressure | UNet2D | RelLp | 500 | 0.0037 | 0.0010 | 0.235549 | - | - | - | 29.2M |
| 7 | pressure | UNet2D | UFNODerivLoss | 500 | 0.0037 | 0.0011 | 0.248648 | - | - | - | 29.0M |
| 8 | pressure | UNet2D | UFNODerivLoss | 500 | 0.0039 | 0.0011 | 0.250622 | - | - | - | 16.3M |
| 9 | pressure | UNet2D | UFNODerivLoss | 500 | 0.0039 | 0.0011 | 0.246458 | - | - | - | 16.3M |
| 10 | pressure | UNet3D | RelLp | 500 | 0.0040 | 0.0013 | 0.286640 | - | - | - | 20.8M |
| 11 | pressure | UNet3D | RelLp | 500 | 0.0042 | 0.0014 | 0.291506 | - | - | - | 20.8M |
| 12 | combined | SegResNet2D | RelLp | 500 | 0.0042 | 0.0012 | 0.271272 | 0.0717 | 7.0054 | 0.001956 | 14.2M |
| 13 | pressure | UNet3D | UFNODerivLoss | 500 | 0.0045 | 0.0014 | 0.296649 | - | - | - | 20.8M |
| 14 | pressure | SwinUNETR2D | RelLp | 500 | 0.0050 | 0.0013 | 0.307502 | - | - | - | 15.2M |
| 15 | pressure | FNO2D | UFNODerivLoss | 500 | 0.0057 | 0.0015 | 0.350251 | - | - | - | 20.2M |
| 16 | combined | SwinUNETR2D | RelLp | 500 | 0.0059 | 0.0017 | 0.397529 | 0.0951 | 8.5406 | 0.002900 | 15.2M |
| 17 | pressure | FNO2D | RelLp | 500 | 0.0064 | 0.0015 | 0.376695 | - | - | - | 9.0M |
| 18 | combined | FNO2D | RelLp | 500 | 0.0068 | 0.0019 | 0.433446 | 0.1152 | 9.9045 | 0.003185 | 9.0M |
| 19 | saturation | FNO2D | UFNODerivLoss | 500 | - | - | - | 0.1197 | 9.9107 | 0.003067 | 20.2M |
| 20 | saturation | FNO2D | RelLp | 500 | - | - | - | 0.1067 | 8.7535 | 0.002723 | 9.0M |
| 21 | saturation | SegResNet2D | RelLp | 500 | - | - | - | 0.0711 | 6.7189 | 0.001596 | 14.2M |
| 22 | saturation | SwinUNETR2D | RelLp | 500 | - | - | - | 0.0880 | 7.7030 | 0.002304 | 15.2M |
| 23 | saturation | UNet2D | RelLp | 500 | - | - | - | 0.0653 | 6.6551 | 0.001726 | 16.3M |
| 24 | saturation | UNet2D | RelLp | 500 | - | - | - | 0.0811 | 8.2827 | 0.002471 | 29.2M |
| 25 | saturation | UNet2D | RelLp | 500 | - | - | - | 0.0811 | 8.2827 | 0.002471 | 29.2M |
| 26 | saturation | UNet2D | UFNODerivLoss | 500 | - | - | - | 0.0829 | 6.2847 | 0.002182 | 16.3M |
| 27 | saturation | UNet2D | UFNODerivLoss | 500 | - | - | - | 0.0804 | 6.4845 | 0.002141 | 16.3M |
| 28 | saturation | UNet2D | RelLp | 500 | - | - | - | 0.0703 | 5.2798 | 0.001675 | 29.0M |
| 29 | saturation | UNet2D | RelLp | 500 | - | - | - | 0.0703 | 5.2798 | 0.001675 | 29.0M |
| 30 | saturation | UNet2D | UFNODerivLoss | 500 | - | - | - | 0.0705 | 6.5478 | 0.001767 | 29.0M |
| 31 | saturation | UNet3D | RelLp | 500 | - | - | - | 0.0657 | 6.1184 | 0.001715 | 20.8M |
| 32 | saturation | UNet3D | RelLp | 500 | - | - | - | 0.1005 | 5.6692 | 0.001667 | 20.8M |
| 33 | saturation | UNet3D | UFNODerivLoss | 500 | - | - | - | 0.0954 | 6.2312 | 0.002083 | 20.8M |
| 34 | saturation | UNet3D | UFNODerivLoss | 500 | - | - | - | 0.0634 | 4.0132 | 0.001151 | 20.8M |
Metrics Over Time
Combined target variant (multiple fields predicted jointly).
Pressure
SATURATION
Paper Metrics Comparison
Metrics from the shared paper-metric module (utils/paper_metrics.py) evaluated on the held-out test split. Loss column distinguishes the training recipe; lower is better.
Targetpressure
| # | Model | Loss | pressure_mre_t1▲ | pressure_mre_t2 |
|---|---|---|---|---|
| 1 | UNet2D | RelLp | 0.3270 | 0.2602 |
| 2 | SegResNet2D | RelLp | 0.3399 | 0.2687 |
| 3 | SwinUNETR2D | RelLp | 0.5143 | 0.4093 |
| 4 | UNet3D | UFNODerivLoss | 0.5180 | 0.4067 |
| 5 | FNO2D | RelLp | 0.5939 | 0.4715 |
| 6 | UNet2D | RelLp | 0.8090 | 0.6334 |
| 7 | UNet2D | UFNODerivLoss | 0.8522 | 0.6794 |
| 8 | UNet2D | UFNODerivLoss | 0.9713 | 0.7676 |
| 9 | UNet2D | UFNODerivLoss | 1.0055 | 0.7941 |
| 10 | UNet3D | RelLp | 1.0849 | 0.8559 |
| 11 | UNet2D | RelLp | 1.1047 | 0.8678 |
| 12 | UNet3D | UFNODerivLoss | 1.8786 | 1.4621 |
| 13 | FNO2D | UFNODerivLoss | 2.1971 | 1.7269 |
| 14 | UNet3D | RelLp | 2.2414 | 1.8172 |
Targetsaturation
| # | Model | Loss | saturation_mape▲ | sat_R2_plume |
|---|---|---|---|---|
| 1 | UNet3D | UFNODerivLoss | 1.3109 | 0.9922 |
| 2 | UNet3D | RelLp | 1.5488 | 0.9927 |
| 3 | UNet2D | RelLp | 1.5831 | 0.9923 |
| 4 | UNet2D | RelLp | 1.5831 | 0.9923 |
| 5 | UNet2D | UFNODerivLoss | 1.6092 | 0.9919 |
| 6 | UNet2D | RelLp | 1.6425 | 0.9932 |
| 7 | SegResNet2D | RelLp | 1.8033 | 0.9919 |
| 8 | UNet2D | UFNODerivLoss | 1.8531 | 0.9891 |
| 9 | UNet2D | UFNODerivLoss | 1.8685 | 0.9894 |
| 10 | UNet2D | RelLp | 2.0092 | 0.9905 |
| 11 | UNet2D | RelLp | 2.0092 | 0.9905 |
| 12 | UNet3D | UFNODerivLoss | 2.0292 | 0.9851 |
| 13 | UNet3D | RelLp | 2.1614 | 0.9821 |
| 14 | SwinUNETR2D | RelLp | 2.3432 | 0.9886 |
| 15 | FNO2D | RelLp | 2.9999 | 0.9835 |
| 16 | FNO2D | UFNODerivLoss | 3.1127 | 0.9772 |
Targetcombined
| # | Model | Loss | pressure_mre_t1▲ | pressure_mre_t2 | saturation_mape | sat_R2_plume |
|---|---|---|---|---|---|---|
| 1 | UNet2D | RelLp | 1.0704 | 0.8395 | 1.7155 | 0.9922 |
| 2 | SegResNet2D | RelLp | 1.1156 | 0.8650 | 1.9105 | 0.9921 |
| 3 | SwinUNETR2D | RelLp | 1.6413 | 1.2700 | 2.6207 | 0.9872 |
| 4 | FNO2D | RelLp | 1.7409 | 1.3629 | 3.3179 | 0.9814 |
About This Benchmark
This benchmark is based on the U-FNO dataset introduced by Wen et al. (2022) for accelerating multiphase CO2-water flow simulations relevant to carbon capture and storage (CCS). The domain is a 2D radial-symmetric cross-section (96 radial cells x 200 vertical cells) representing a deep saline aquifer with CO2 injection.
The simulations model supercritical CO2 injection into a heterogeneous aquifer, capturing the interplay between viscous, gravitational, and capillary forces that govern CO2 plume migration and pressure buildup. The radial symmetry reduces the 3D problem to a computationally efficient 2D representation while preserving the essential physics of single-well injection.
Each simulation produces 24 prediction timesteps capturing the evolution of pressure buildup and gas (CO2) saturation. The input features include the permeability and porosity fields of the aquifer rock, along with injection parameters that control the CO2 injection rate and duration.
This dataset is particularly relevant for risk assessment in CCS projects, where rapid evaluation of thousands of geological scenarios is needed to quantify uncertainty in plume extent and pressure response.
Input features
Paper metrics explained
Training Configuration
Configuration for the best-performing model (UNet3D).