Two-Phase 3D Channels
3D two-phase flow benchmark on a 40x40x20 channel model. Models predict pressure and saturation at 10 selected timesteps from permeability and initial conditions.
3D channel saturation case study
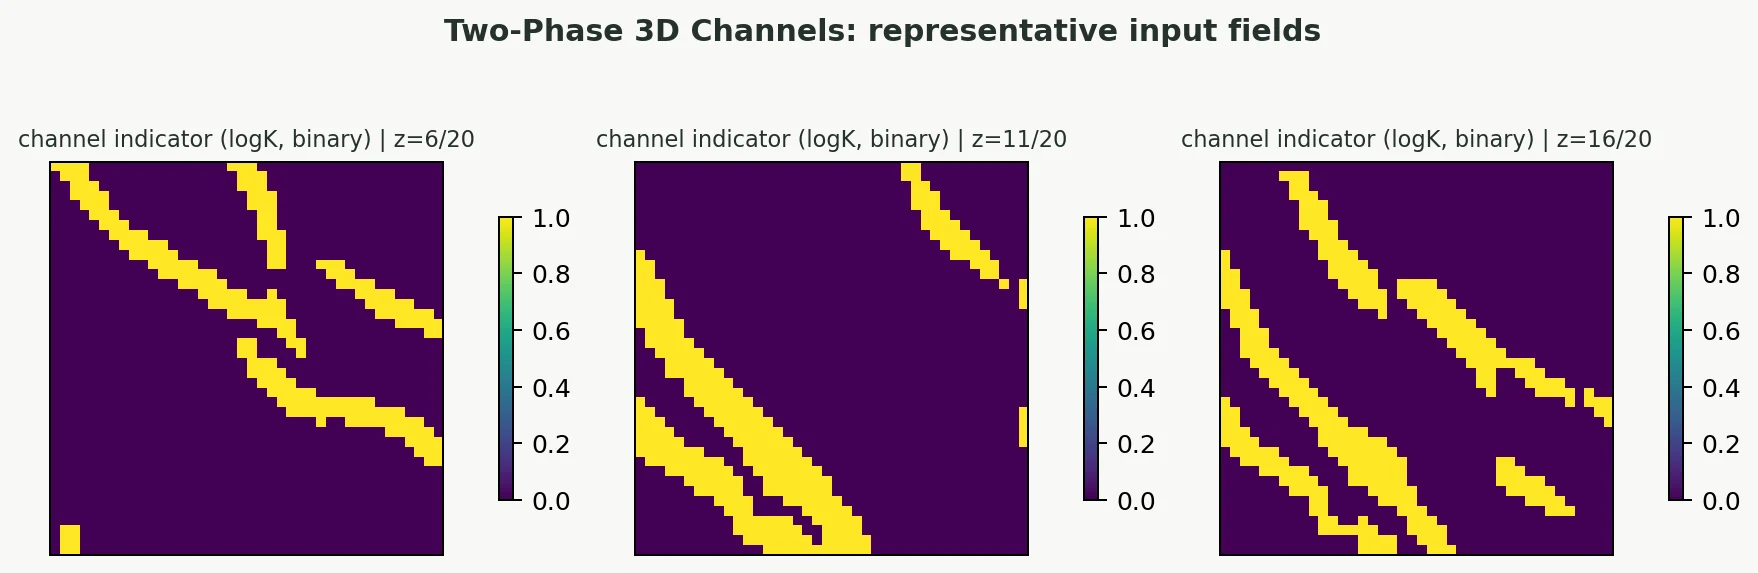
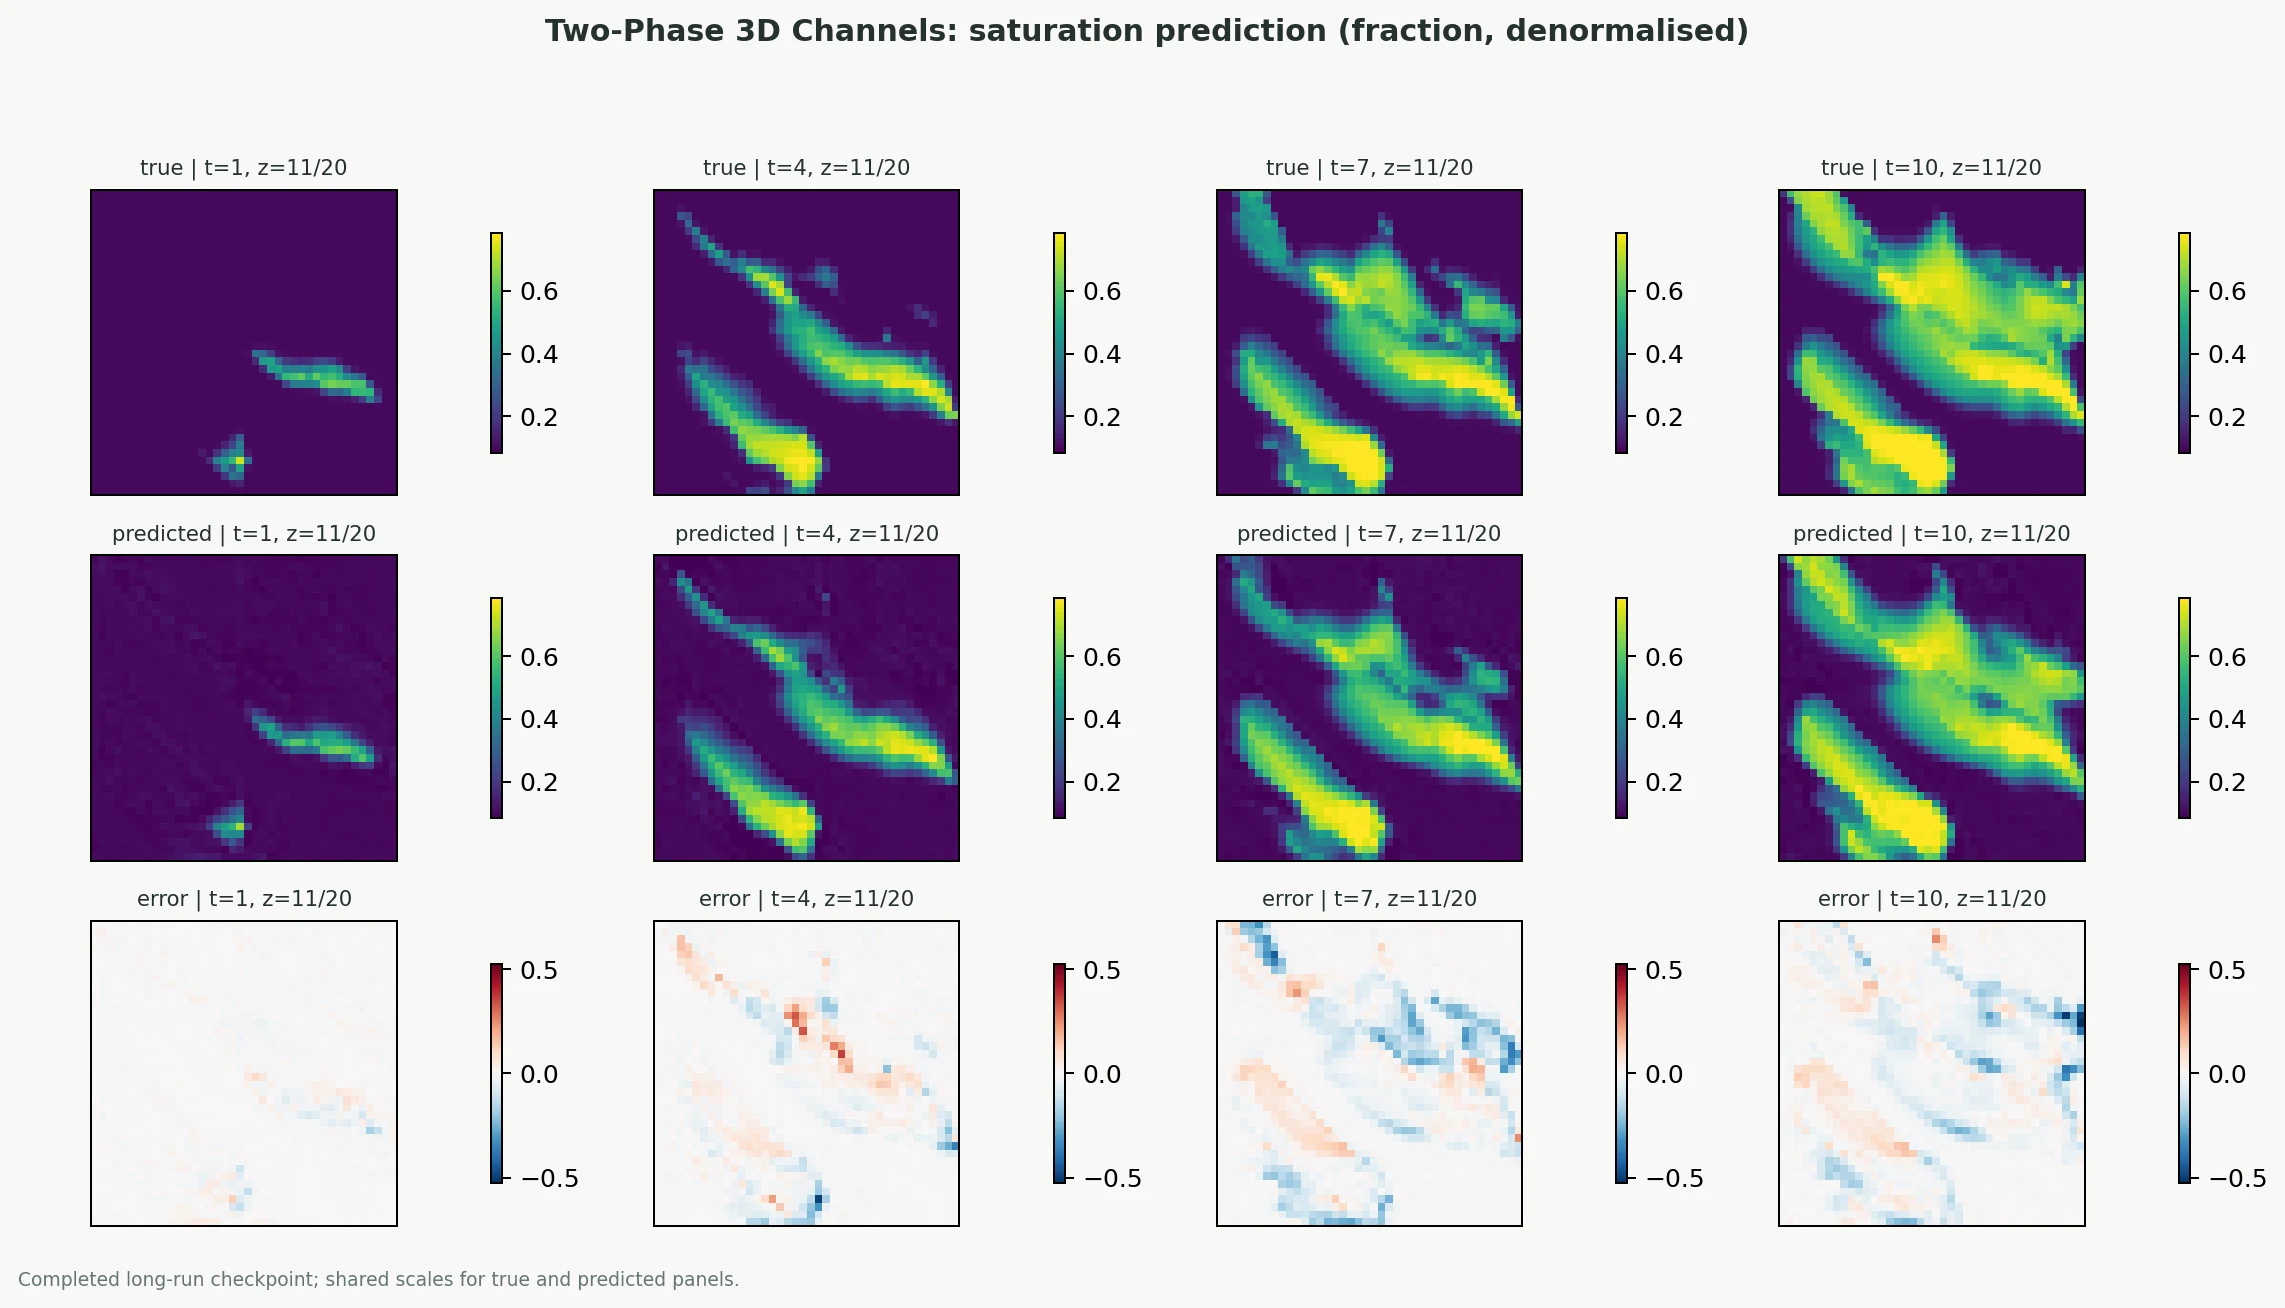
Static figures from a completed long-run. The panels show the model input context, including initial-state fields, plus the true water saturation, the prediction, and the signed error at selected timesteps for a held-out case.
Representative held-out case
Leaderboard
| Pres (bar) | Sat (frac) | ||||||||||
|---|---|---|---|---|---|---|---|---|---|---|---|
| # | Target | Model | Loss | Epochs | rel-L²▲ | MRE | MAE | rel-L² | MRE | MAE | Params |
| 1 | pressure | UNet3D | RelLp | 500 | 0.0007 | 0.0005 | 0.163858 | - | - | - | 20.8M |
| 2 | pressure | UNet3D | RelLp | 200 | 0.0007 | 0.0006 | 0.181097 | - | - | - | 20.8M |
| 3 | pressure | SegResNet | RelLp | 500 | 0.0008 | 0.0006 | 0.180418 | - | - | - | 18.8M |
| 4 | combined | UNet3D | RelLp | 500 | 0.0009 | 0.0006 | 0.206761 | 0.1278 | 0.0758 | 0.015825 | 20.8M |
| 5 | combined | UNet3D | RelLp | 200 | 0.0010 | 0.0007 | 0.231114 | 0.1320 | 0.0899 | 0.018015 | 20.8M |
| 6 | combined | SegResNet | RelLp | 500 | 0.0011 | 0.0008 | 0.258867 | 0.1426 | 0.0867 | 0.018484 | 18.8M |
| 7 | pressure | SwinUNETR | RelLp | 500 | 0.0012 | 0.0009 | 0.280578 | - | - | - | 15.7M |
| 8 | combined | SwinUNETR | RelLp | 500 | 0.0015 | 0.0011 | 0.354836 | 0.1645 | 0.0996 | 0.021278 | 15.7M |
| 9 | pressure | FNO3D | RelLp | 500 | 0.0021 | 0.0015 | 0.491382 | - | - | - | 9.0M |
| 10 | combined | FNO3D | RelLp | 500 | 0.0022 | 0.0017 | 0.539620 | 0.2223 | 0.1442 | 0.031166 | 9.0M |
| 11 | pressure | FNO3D | RelLp | 200 | 0.0024 | 0.0018 | 0.582078 | - | - | - | 9.0M |
| 12 | combined | FNO3D | RelLp | 200 | 0.0026 | 0.0020 | 0.640025 | 0.2308 | 0.1786 | 0.036466 | 9.0M |
| 13 | saturation | FNO3D | RelLp | 200 | - | - | - | 0.2312 | 0.1648 | 0.034480 | 9.0M |
| 14 | saturation | FNO3D | RelLp | 500 | - | - | - | 0.2310 | 0.1571 | 0.033396 | 9.0M |
| 15 | saturation | SegResNet | RelLp | 500 | - | - | - | 0.1435 | 0.0779 | 0.017513 | 18.8M |
| 16 | saturation | SwinUNETR | RelLp | 500 | - | - | - | 0.1637 | 0.0890 | 0.019917 | 15.7M |
| 17 | saturation | UNet3D | RelLp | 200 | - | - | - | 0.1323 | 0.0807 | 0.017179 | 20.8M |
| 18 | saturation | UNet3D | RelLp | 500 | - | - | - | 0.1298 | 0.0709 | 0.015528 | 20.8M |
Metrics Over Time
Combined target variant (multiple fields predicted jointly). Predictions at 10 selected timesteps: [1, 2, 3, 6, 8, 10, 12, 14, 17, 20].
SAT
Pressure
Paper Metrics Comparison
Metrics from the shared paper-metric module (utils/paper_metrics.py) evaluated on the held-out test split. Loss column distinguishes the training recipe; lower is better.
Targetpressure
| # | Model | Loss | Epochs | delta_p▲ | pressure_mre_t1 | pressure_mre_t2 | pressure_mre_pinit |
|---|---|---|---|---|---|---|---|
| 1 | UNet3D | RelLp | 500 | 0.0072 | 0.7282 | 0.7206 | 0.0512 |
| 2 | SegResNet | RelLp | 500 | 0.0079 | 0.8006 | 0.7923 | 0.0564 |
| 3 | UNet3D | RelLp | 200 | 0.0080 | 0.8035 | 0.7952 | 0.0566 |
| 4 | SwinUNETR | RelLp | 500 | 0.0123 | 1.2440 | 1.2312 | 0.0877 |
| 5 | FNO3D | RelLp | 500 | 0.0216 | 2.1788 | 2.1565 | 0.1536 |
| 6 | FNO3D | RelLp | 200 | 0.0255 | 2.5802 | 2.5539 | 0.1819 |
Targetsaturation
| # | Model | Loss | Epochs | delta_S▲ | saturation_mape |
|---|---|---|---|---|---|
| 1 | UNet3D | RelLp | 500 | 0.0709 | 1.5528 |
| 2 | SegResNet | RelLp | 500 | 0.0779 | 1.7513 |
| 3 | UNet3D | RelLp | 200 | 0.0807 | 1.7179 |
| 4 | SwinUNETR | RelLp | 500 | 0.0890 | 1.9917 |
| 5 | FNO3D | RelLp | 500 | 0.1571 | 3.3396 |
| 6 | FNO3D | RelLp | 200 | 0.1648 | 3.4480 |
Targetcombined
| # | Model | Loss | Epochs | delta_S▲ | saturation_mape | delta_p | pressure_mre_t1 | pressure_mre_t2 | pressure_mre_pinit |
|---|---|---|---|---|---|---|---|---|---|
| 1 | UNet3D | RelLp | 500 | 0.0758 | 1.5825 | 0.0091 | 0.9180 | 0.9085 | 0.0646 |
| 2 | SegResNet | RelLp | 500 | 0.0867 | 1.8484 | 0.0114 | 1.1494 | 1.1375 | 0.0809 |
| 3 | UNet3D | RelLp | 200 | 0.0899 | 1.8015 | 0.0102 | 1.0261 | 1.0155 | 0.0722 |
| 4 | SwinUNETR | RelLp | 500 | 0.0996 | 2.1278 | 0.0156 | 1.5737 | 1.5575 | 0.1109 |
| 5 | FNO3D | RelLp | 500 | 0.1442 | 3.1166 | 0.0237 | 2.3937 | 2.3691 | 0.1686 |
| 6 | FNO3D | RelLp | 200 | 0.1786 | 3.6466 | 0.0281 | 2.8381 | 2.8090 | 0.2000 |
About This Benchmark
This benchmark is based on the 3D Recurrent R-U-Net dataset introduced by Tang et al. (2021). It features two-phase flow simulations on 3D channelized reservoir models with a 40x40x20 grid. The channel models represent geological formations with meandering high-permeability sand bodies embedded in low-permeability shale — a common and challenging geological setting for subsurface flow prediction.
The original dataset contains 2923 satisfying simulation cases stored in a single HDF5 file. Each case provides a binary channel indicator field (logk), along with water saturation and pressure fields over 21 timesteps. Following Tang et al.'s methodology, predictions are made on a hand-picked subset of 10 specific timesteps: [1, 2, 3, 6, 8, 10, 12, 14, 17, 20]. These timesteps are sampled densely at early time (where pressure and saturation transients are fast) and sparsely at later times (where the fields evolve slowly).
The data is split sequentially (no randomization): 80% train (~2338 cases), 10% validation (~292 cases), and 10% test (~293 cases).
Important methodological note: Tang et al.'s original work uses test data for validation (i.e., model selection), which inflates reported accuracy. Our benchmark properly separates validation and test sets, meaning our reported metrics are on truly held-out data and may appear slightly worse than Tang's published numbers. This is a fairer comparison.
Input features consist of 2 channels: the permeability indicator field (logk) and the initial condition (saturation at t=0 for saturation prediction, pressure at t=0 for pressure prediction). For combined prediction, 3 input channels are used (logk, sat_t0, pres_t0).
Dataset details
- Total cases
- 2923
- train
- 2338
- val
- 292
- test
- 293
- method
- Sequential (no randomization)
- Timestep indices
- [1, 2, 3, 6, 8, 10, 12, 14, 17, 20]
Input features
Paper metrics explained
Training Configuration
Configuration for the best-performing model (UNet3D).