Two-Phase Oil-Water
2D Cartesian two-phase oil-water flow benchmark. Models predict pressure and water saturation over 40 timesteps from permeability, well configuration, and initial state on a 40x40 grid.
Oil-water saturation case study
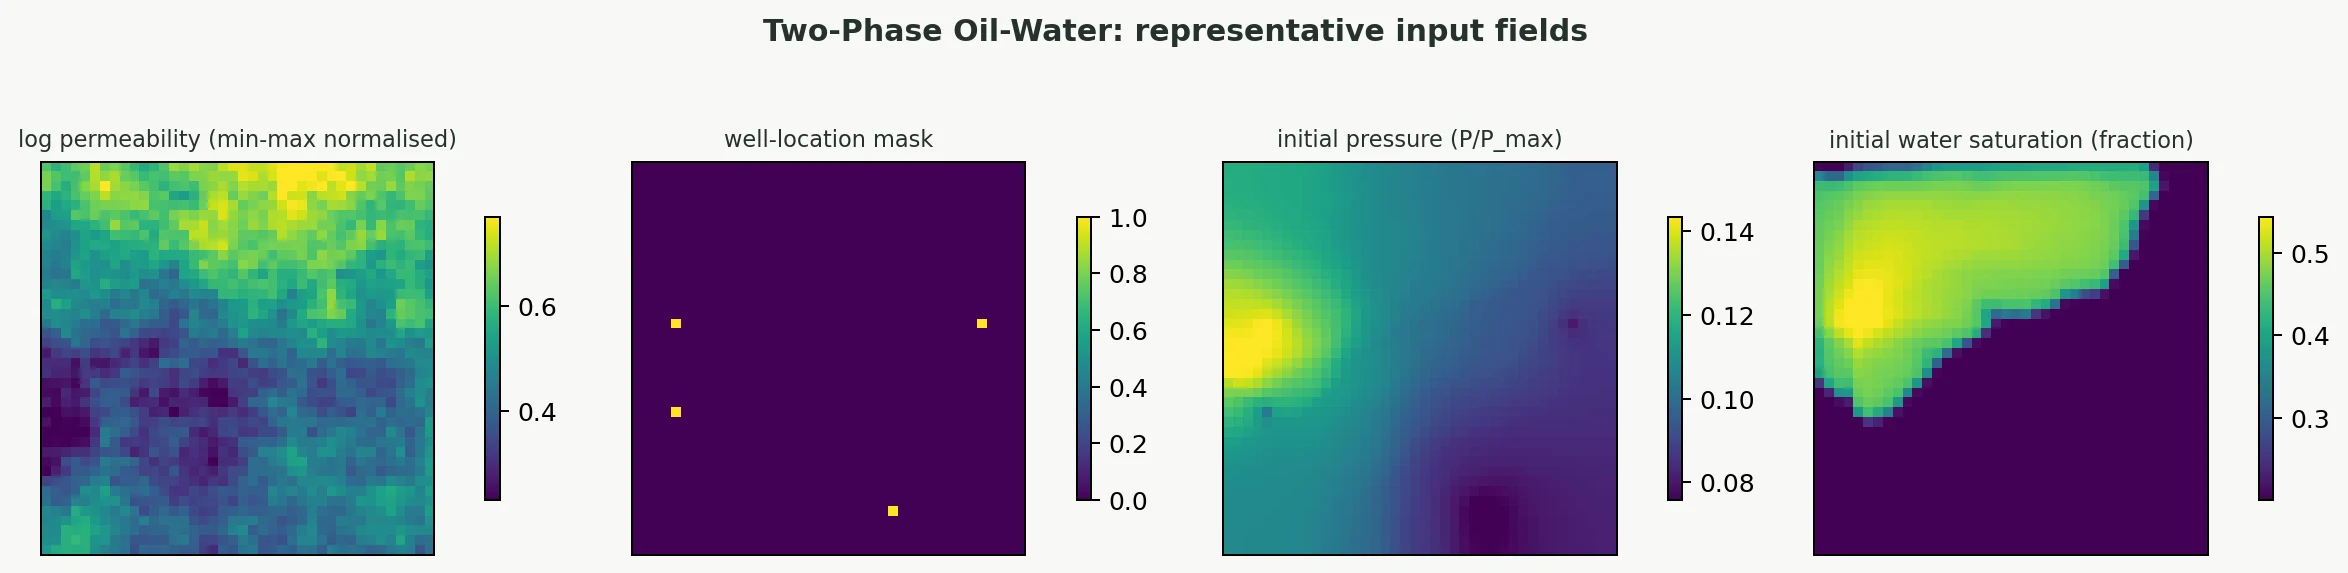
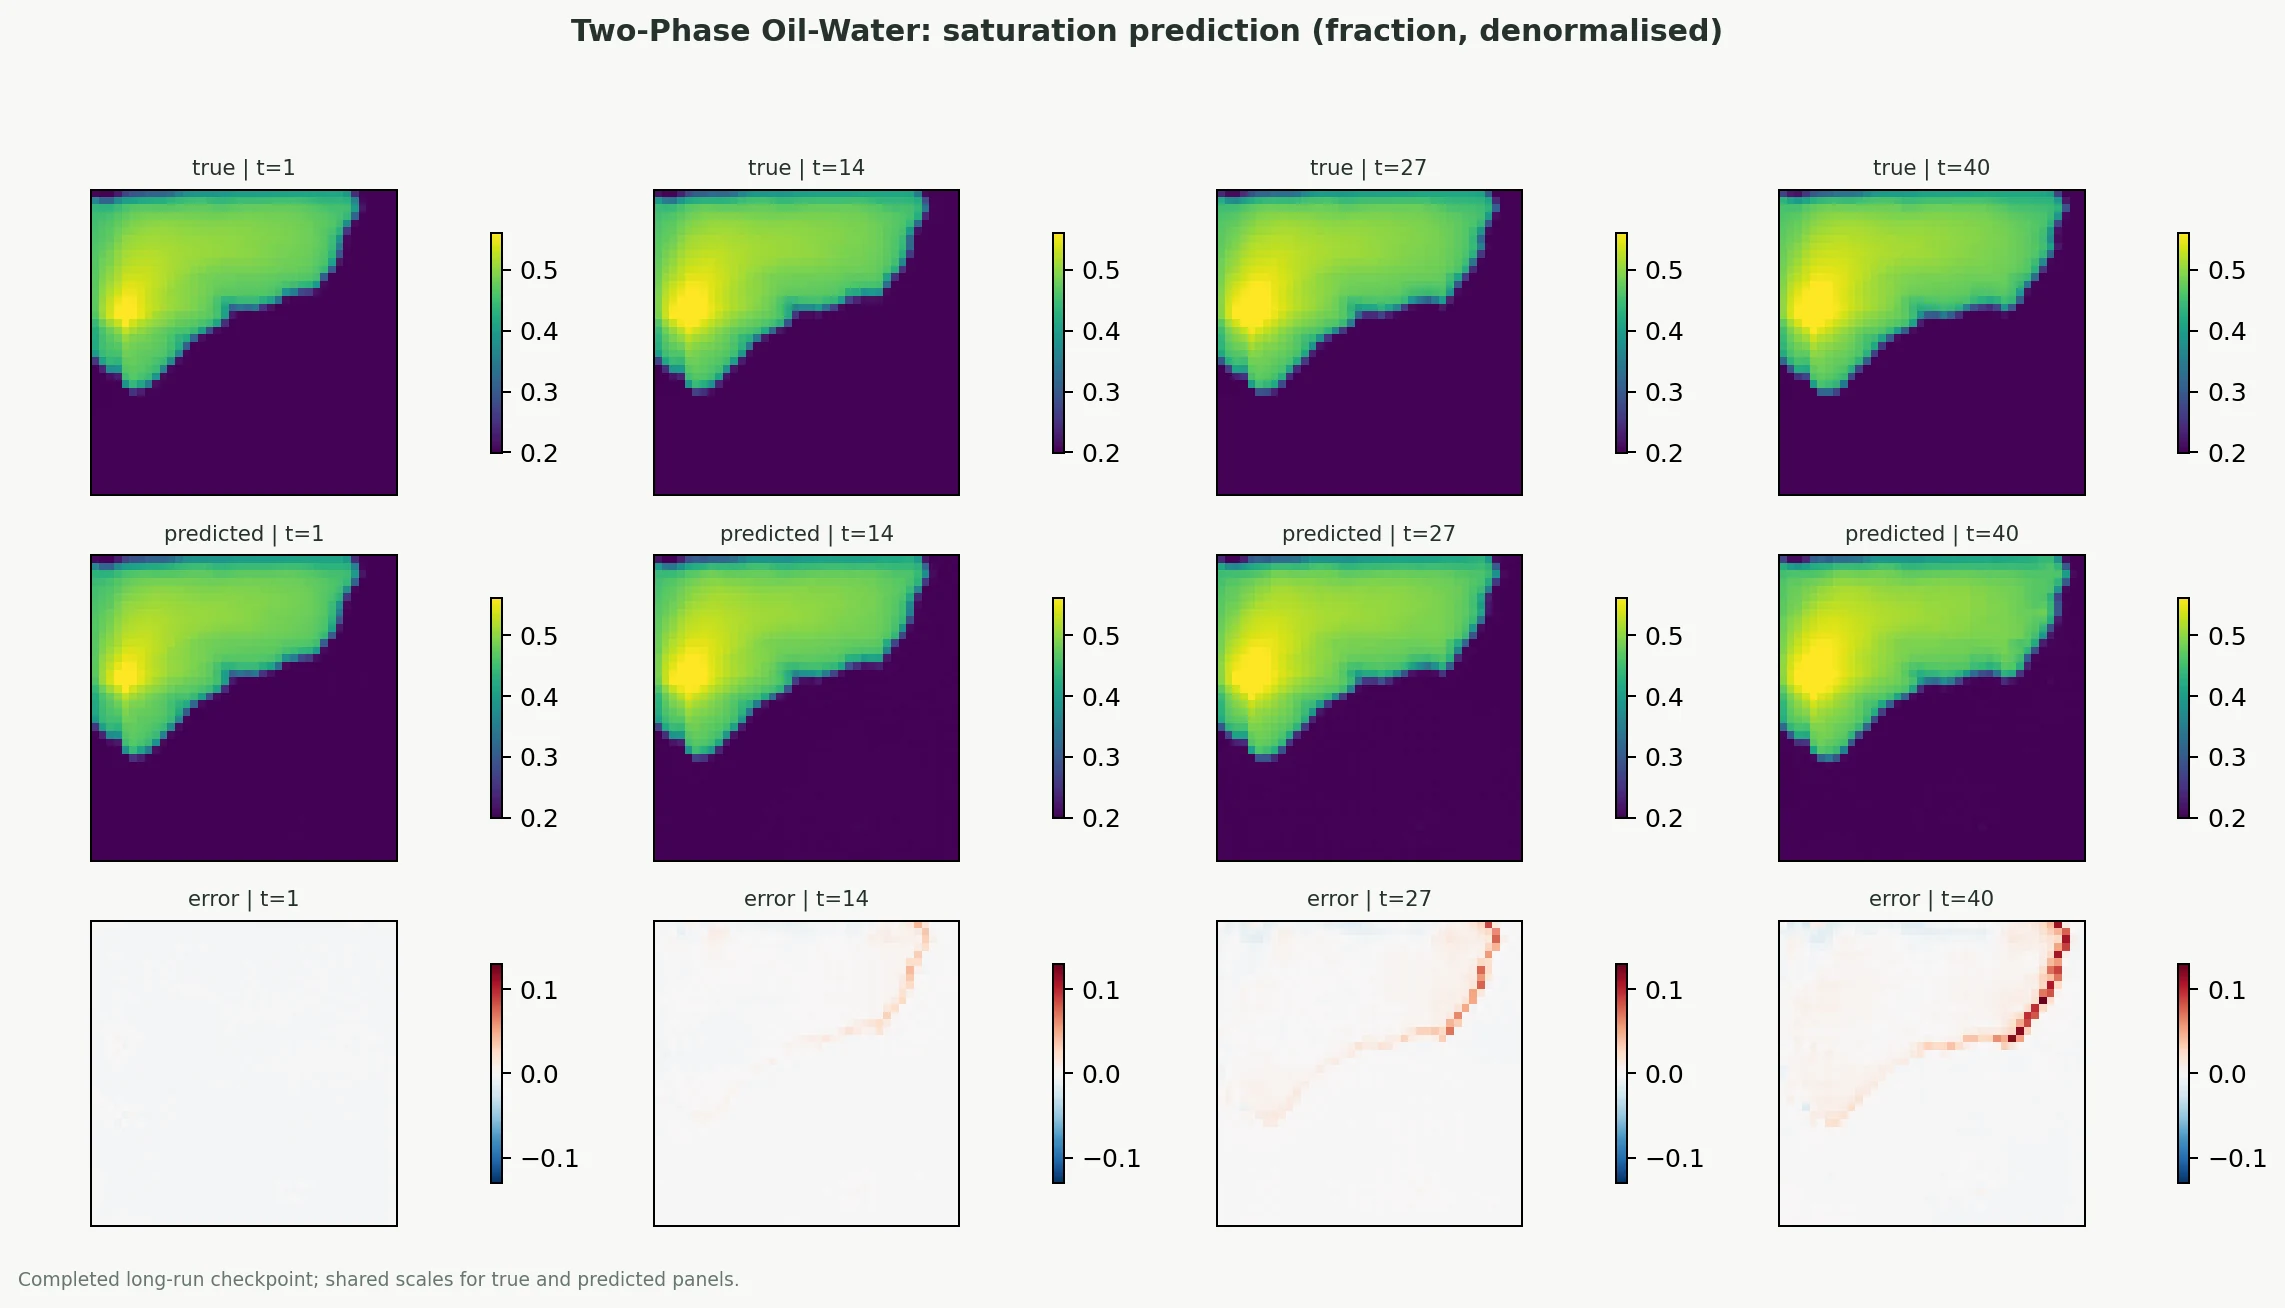
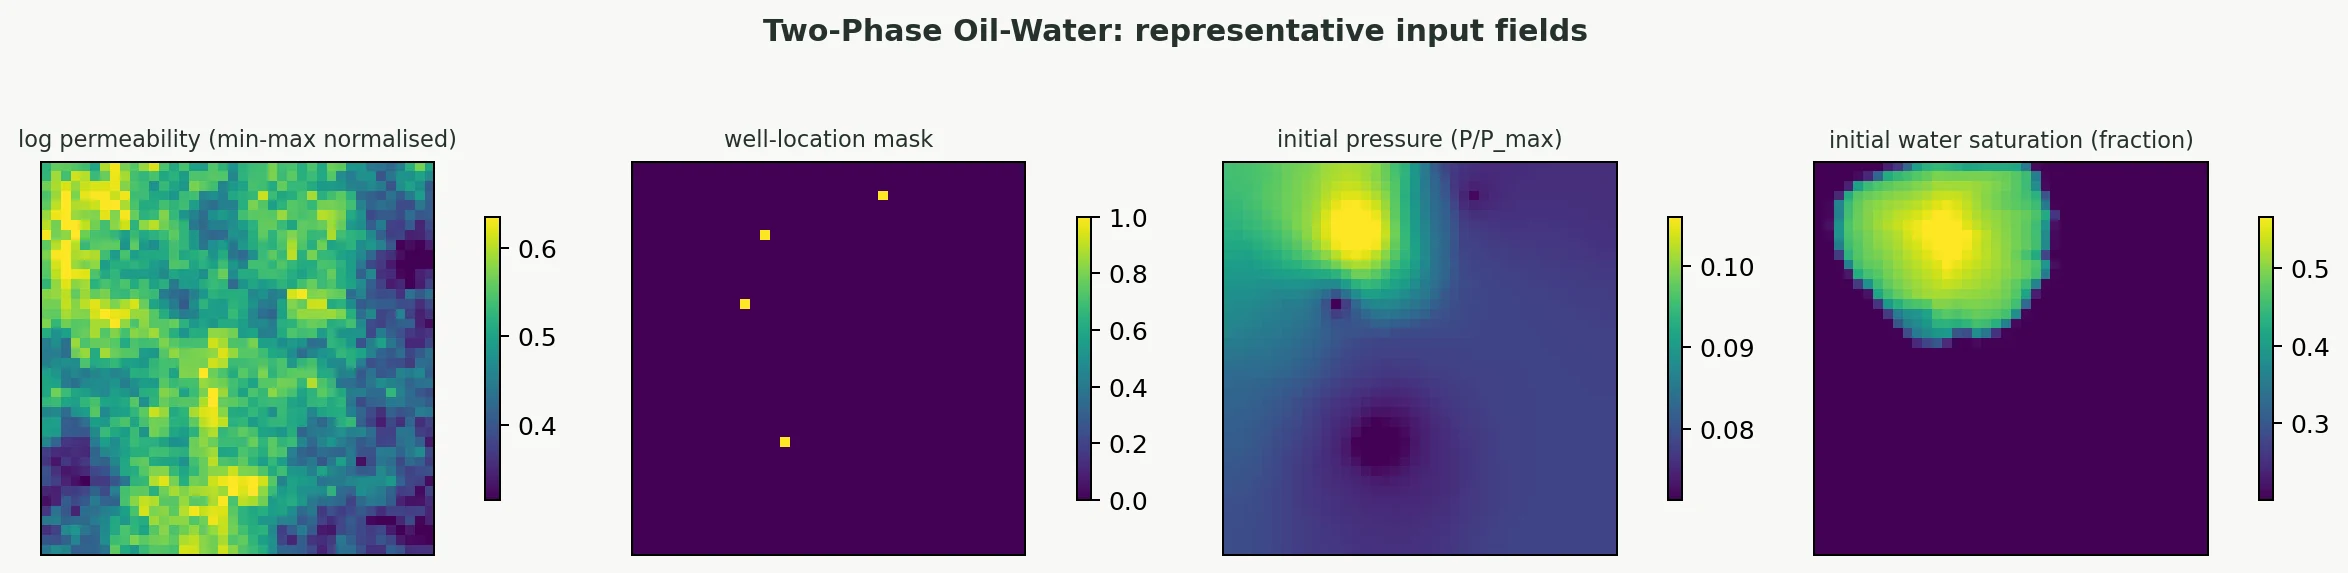
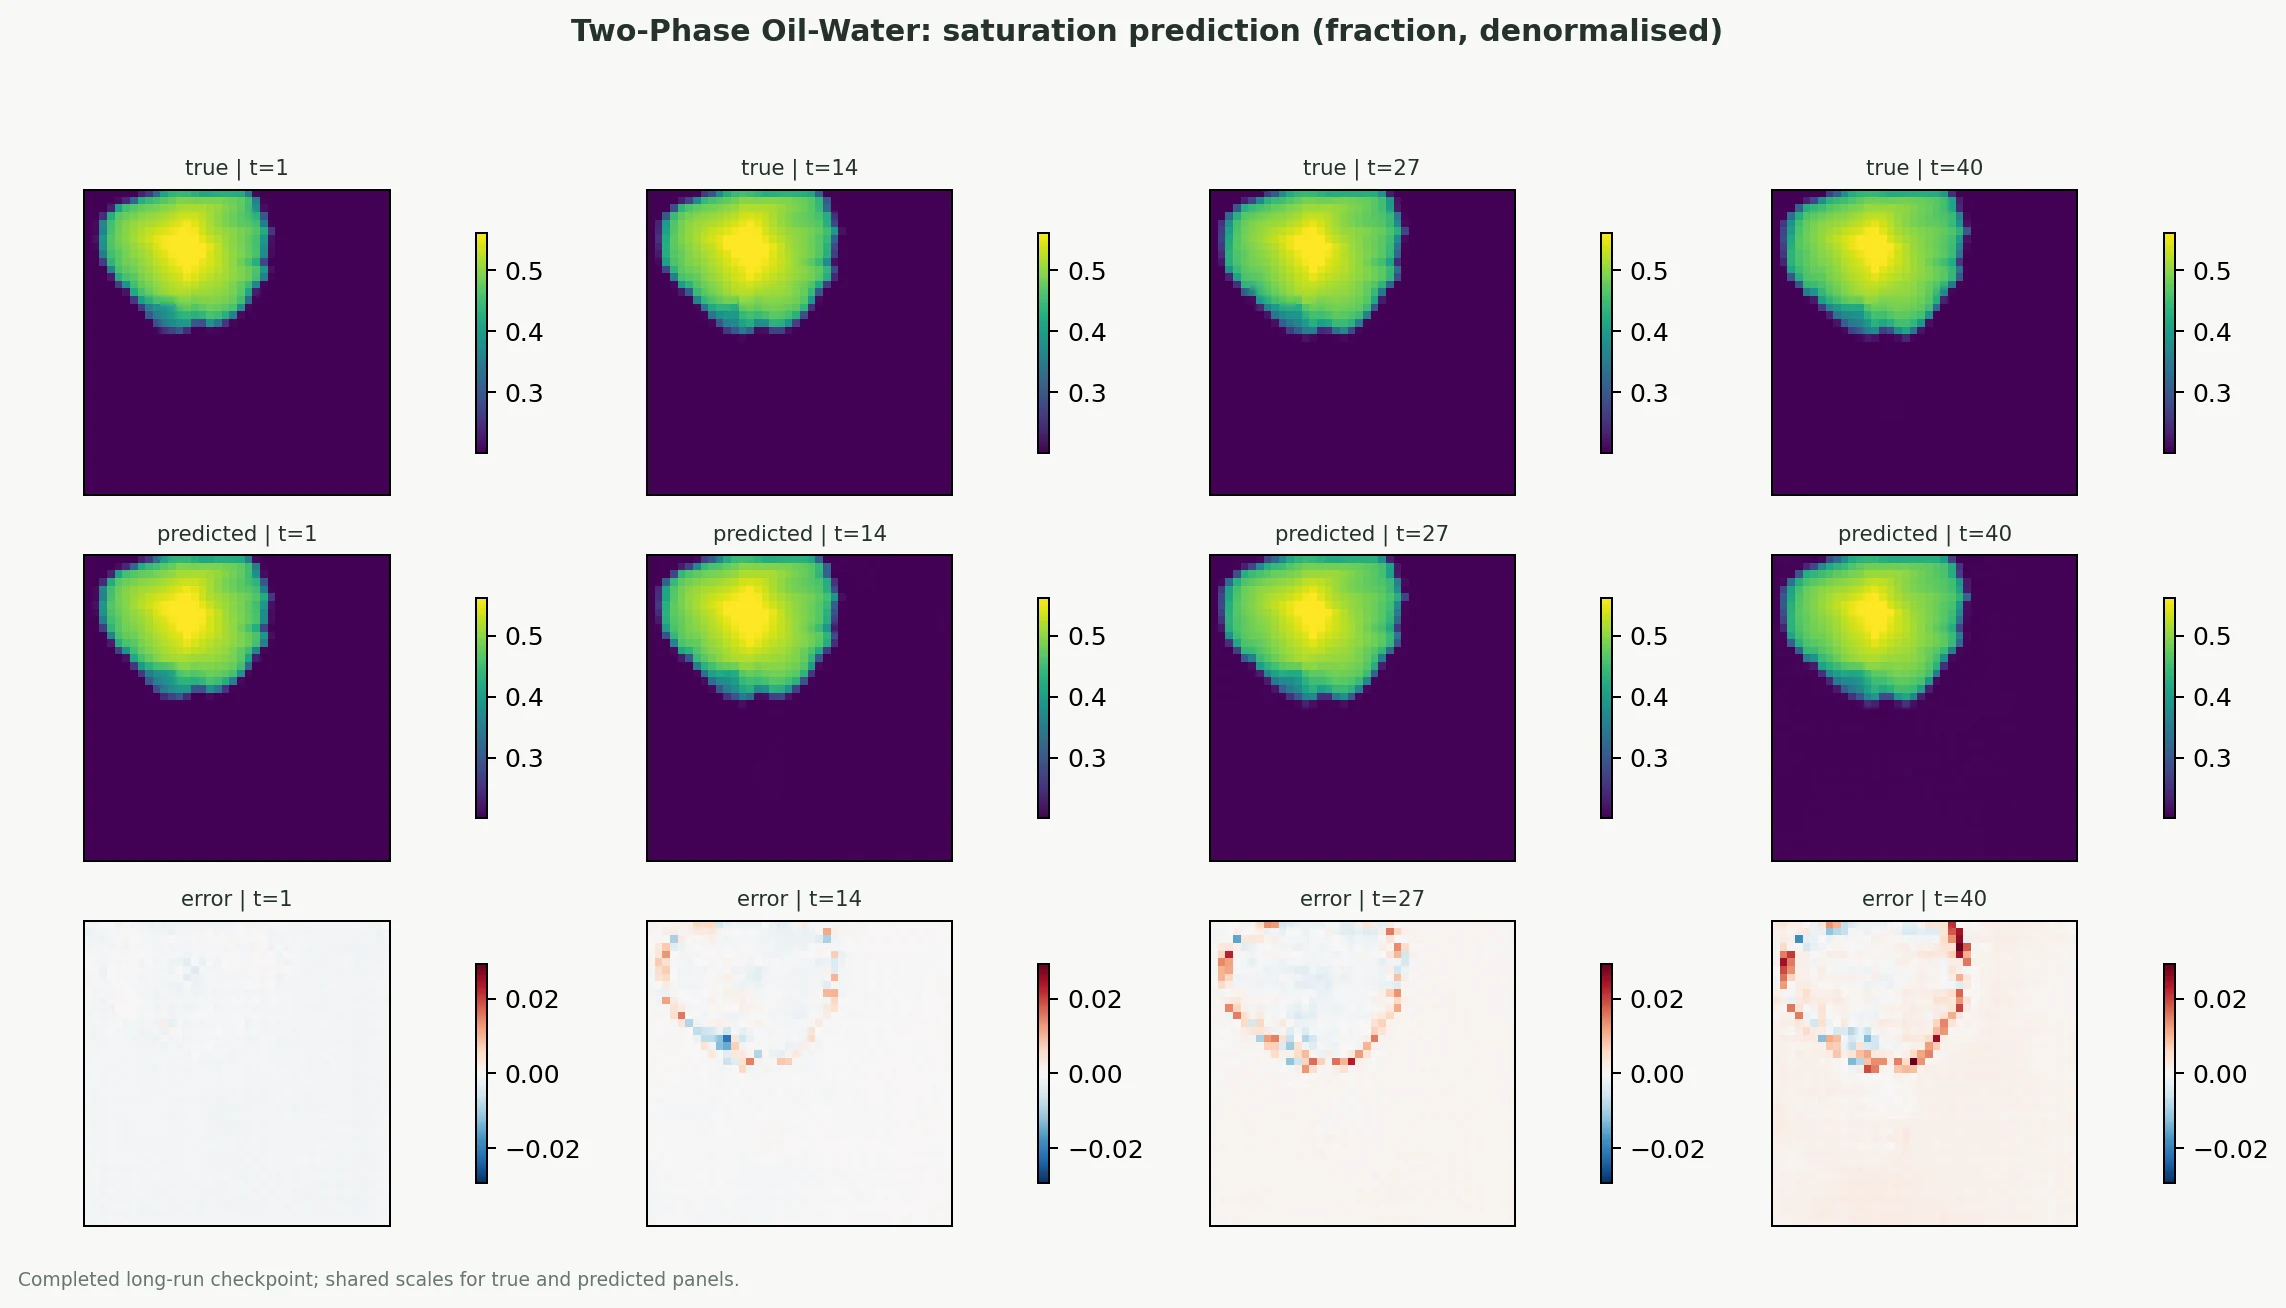
Static figures from a completed 500-epoch run. The panels show the model input context, including initial-state fields, plus the true water saturation, the prediction, and the signed error at selected timesteps for a held-out case.
Held-out sample A
Held-out sample B
500-Epoch Long-Run Evidence
UNet2D trained to convergence on the held-out test split, rendered alongside the Chen et al. 2025 APT published baseline (italicised reference rows) for direct comparison on the same metrics. Lower is better.
| Target | Model | Size | Loss | Overall rel-L² | Pressure rel-L² | Saturation rel-L² | APT delta_p | APT delta_sw |
|---|---|---|---|---|---|---|---|---|
| combined | UNet2D | 16.38M | Rel-Lp + Deriv. | 0.0192 | 0.0172 | 0.0211 | 0.801% | 0.161% |
| pressure | UNet2D | 16.36M | Rel-Lp + Deriv. | 0.0223 | 0.0223 | - | 1.051% | - |
| saturation | UNet2D | 16.36M | Rel-Lp + Deriv. | 0.0319 | - | 0.0319 | - | 0.190% |
| reference | FNO(APT, Chen 2025) | 31.00M | Chen et al. | - | - | - | 1.850% | 1.280% |
| reference | U-FNO(APT, Chen 2025) | 33.00M | Chen et al. | - | - | - | 0.570% | 0.660% |
| reference | APT(APT, Chen 2025) | 12.00M | Chen et al. | - | - | - | 0.600% | 0.320% |
200-Epoch Architecture Comparison
Broader sweep across architectures at a matched 200-epoch training budget. Useful for like-for-like architecture comparison; the 500-epoch table above shows what UNet2D achieves with extended training.
| Target | Model | Size | Loss | Overall rel-L² | Pressure rel-L² | Saturation rel-L² | APT delta_p | APT delta_sw |
|---|---|---|---|---|---|---|---|---|
| combined | UNet2D | 16.38M | Rel-Lp + Deriv. | 0.0205 | 0.0176 | 0.0234 | 0.823% | 0.207% |
| combined | UNet2D | 7.30M | Rel-Lp | 0.0256 | 0.0243 | 0.0268 | 1.138% | 0.151% |
| combined | UNet2D | 16.38M | Rel-Lp | 0.0264 | 0.0284 | 0.0243 | 1.498% | 0.153% |
| combined | SegResNet2D | 14.21M | Rel-Lp | 0.0380 | 0.0384 | 0.0375 | 1.879% | 0.289% |
| combined | SegResNet2D | 6.33M | Rel-Lp | 0.0442 | 0.0483 | 0.0401 | 2.477% | 0.389% |
| combined | FNO2D | 14.66M | Rel-Lp | 0.0469 | 0.0434 | 0.0504 | 2.156% | 0.242% |
| combined | SwinUNETR2D | 15.21M | Rel-Lp | 0.0535 | 0.0543 | 0.0527 | 2.659% | 0.570% |
| combined | FNO2D | 2.43M | Rel-Lp | 0.0547 | 0.0555 | 0.0539 | 2.878% | 0.285% |
| combined | SwinUNETR2D | 6.79M | Rel-Lp | 0.0556 | 0.0566 | 0.0547 | 2.725% | 0.574% |
| pressure | UNet2D | 16.36M | Rel-Lp + Deriv. | 0.0251 | 0.0251 | - | 1.191% | - |
| pressure | UNet2D | 7.29M | Rel-Lp | 0.0317 | 0.0317 | - | 1.584% | - |
| pressure | UNet2D | 16.36M | Rel-Lp | 0.0351 | 0.0351 | - | 1.788% | - |
| pressure | SwinUNETR2D | 15.21M | Rel-Lp | 0.0420 | 0.0420 | - | 2.085% | - |
| pressure | SegResNet2D | 6.32M | Rel-Lp | 0.0454 | 0.0454 | - | 2.382% | - |
| pressure | SegResNet2D | 14.20M | Rel-Lp | 0.0500 | 0.0500 | - | 2.593% | - |
| pressure | SwinUNETR2D | 6.79M | Rel-Lp | 0.0554 | 0.0554 | - | 2.679% | - |
| pressure | FNO2D | 14.65M | Rel-Lp | 0.0581 | 0.0581 | - | 2.946% | - |
| pressure | FNO2D | 2.43M | Rel-Lp | 0.0596 | 0.0596 | - | 3.058% | - |
| saturation | UNet2D | 16.36M | Rel-Lp | 0.0299 | - | 0.0299 | - | 0.168% |
| saturation | UNet2D | 7.29M | Rel-Lp | 0.0319 | - | 0.0319 | - | 0.183% |
| saturation | UNet2D | 16.36M | Rel-Lp + Deriv. | 0.0345 | - | 0.0345 | - | 0.224% |
| saturation | SegResNet2D | 14.20M | Rel-Lp | 0.0407 | - | 0.0407 | - | 0.310% |
| saturation | SegResNet2D | 6.32M | Rel-Lp | 0.0436 | - | 0.0436 | - | 0.329% |
| saturation | SwinUNETR2D | 15.21M | Rel-Lp | 0.0479 | - | 0.0479 | - | 0.511% |
| saturation | SwinUNETR2D | 6.79M | Rel-Lp | 0.0539 | - | 0.0539 | - | 0.501% |
| saturation | FNO2D | 14.65M | Rel-Lp | 0.0565 | - | 0.0565 | - | 0.278% |
| saturation | FNO2D | 2.43M | Rel-Lp | 0.0617 | - | 0.0617 | - | 0.314% |
Leaderboard
| Pres (bar) | Sat (frac) | ||||||||||
|---|---|---|---|---|---|---|---|---|---|---|---|
| # | Target | Model | Loss | Epochs | rel-L²▲ | MRE | MAE | rel-L² | MRE | MAE | Params |
| 1 | combined | UNet3D | BadawiCombined | 2000 | 0.0103 | 0.0086 | 1.430230 | 0.0182 | 0.0140 | 0.004765 | 20.8M |
| 2 | combined | UNet3D | BadawiCombined | 200 | 0.0142 | 0.0124 | 2.176428 | 0.0254 | 0.0207 | 0.007156 | 20.8M |
| 3 | combined | UNet2D | BadawiCombined | 4000 | 0.0143 | 0.0121 | 2.038741 | 0.0202 | 0.0151 | 0.005132 | 29.1M |
| 4 | combined | UNet2D | BadawiCombined | 4000 | 0.0150 | 0.0128 | 2.136473 | 0.0200 | 0.0147 | 0.005032 | 16.4M |
| 5 | combined | UNet2D | BadawiCombined | 4000 | 0.0165 | 0.0142 | 2.364149 | 0.0209 | 0.0154 | 0.005240 | 29.1M |
| 6 | combined | UNet2D | BadawiCombined | 500 | 0.0179 | 0.0149 | 2.469467 | 0.0239 | 0.0180 | 0.006175 | 16.4M |
| 7 | pressure | UNet2D | BadawiSingleField | 500 | 0.0215 | 0.0192 | 3.150069 | - | - | - | 16.4M |
| 8 | combined | UNet2D | RelLp | 200 | 0.0243 | 0.0204 | 3.415011 | 0.0268 | 0.0201 | 0.006798 | 7.3M |
| 9 | pressure | UNet3D | BadawiSingleField | 200 | 0.0284 | 0.0268 | 4.242195 | - | - | - | 20.8M |
| 10 | combined | UNet2D | RelLp | 200 | 0.0284 | 0.0259 | 4.494401 | 0.0243 | 0.0187 | 0.006455 | 16.4M |
| 11 | pressure | UNet2D | RelLp | 200 | 0.0317 | 0.0278 | 4.753270 | - | - | - | 7.3M |
| 12 | pressure | FNO3D | BadawiSingleField | 200 | 0.0344 | 0.0300 | 5.154885 | - | - | - | 5.6M |
| 13 | pressure | UNet2D | RelLp | 200 | 0.0351 | 0.0316 | 5.364382 | - | - | - | 16.4M |
| 14 | combined | SegResNet2D | RelLp | 200 | 0.0384 | 0.0336 | 5.636361 | 0.0375 | 0.0307 | 0.010878 | 14.2M |
| 15 | combined | FNO3D | BadawiCombined | 200 | 0.0415 | 0.0357 | 6.102467 | 0.0532 | 0.0423 | 0.014022 | 5.6M |
| 16 | pressure | SwinUNETR2D | RelLp | 200 | 0.0420 | 0.0360 | 6.253993 | - | - | - | 15.2M |
| 17 | combined | FNO2D | RelLp | 200 | 0.0434 | 0.0375 | 6.469421 | 0.0504 | 0.0379 | 0.012490 | 14.7M |
| 18 | pressure | SegResNet2D | RelLp | 200 | 0.0454 | 0.0406 | 7.145418 | - | - | - | 6.3M |
| 19 | combined | SegResNet2D | RelLp | 200 | 0.0483 | 0.0435 | 7.430982 | 0.0401 | 0.0333 | 0.011306 | 6.3M |
| 20 | pressure | SegResNet2D | RelLp | 200 | 0.0500 | 0.0465 | 7.779330 | - | - | - | 14.2M |
| 21 | combined | SwinUNETR2D | RelLp | 200 | 0.0543 | 0.0464 | 7.977582 | 0.0527 | 0.0434 | 0.016646 | 15.2M |
| 22 | pressure | SwinUNETR2D | RelLp | 200 | 0.0554 | 0.0453 | 8.037558 | - | - | - | 6.8M |
| 23 | combined | FNO2D | RelLp | 200 | 0.0555 | 0.0482 | 8.634762 | 0.0539 | 0.0414 | 0.013596 | 2.4M |
| 24 | combined | SwinUNETR2D | RelLp | 200 | 0.0566 | 0.0478 | 8.175237 | 0.0547 | 0.0459 | 0.016938 | 6.8M |
| 25 | pressure | FNO2D | RelLp | 200 | 0.0581 | 0.0521 | 8.838425 | - | - | - | 14.6M |
| 26 | pressure | FNO2D | RelLp | 200 | 0.0596 | 0.0528 | 9.173145 | - | - | - | 2.4M |
| 27 | saturation | FNO2D | RelLp | 200 | - | - | - | 0.0617 | 0.0465 | 0.015350 | 2.4M |
| 28 | saturation | FNO2D | RelLp | 200 | - | - | - | 0.0565 | 0.0426 | 0.014027 | 14.6M |
| 29 | saturation | FNO3D | BadawiSingleField | 200 | - | - | - | 0.0555 | 0.0431 | 0.014490 | 5.6M |
| 30 | saturation | SegResNet2D | RelLp | 200 | - | - | - | 0.0436 | 0.0347 | 0.011877 | 6.3M |
| 31 | saturation | SegResNet2D | RelLp | 200 | - | - | - | 0.0407 | 0.0331 | 0.011496 | 14.2M |
| 32 | saturation | SwinUNETR2D | RelLp | 200 | - | - | - | 0.0539 | 0.0431 | 0.015861 | 6.8M |
| 33 | saturation | SwinUNETR2D | RelLp | 200 | - | - | - | 0.0479 | 0.0403 | 0.015003 | 15.2M |
| 34 | saturation | UNet2D | RelLp | 200 | - | - | - | 0.0319 | 0.0243 | 0.008113 | 7.3M |
| 35 | saturation | UNet2D | RelLp | 200 | - | - | - | 0.0299 | 0.0227 | 0.007628 | 16.4M |
| 36 | saturation | UNet2D | BadawiSingleField | 500 | - | - | - | 0.0302 | 0.0234 | 0.007880 | 16.4M |
| 37 | saturation | UNet3D | BadawiSingleField | 200 | - | - | - | 0.0240 | 0.0181 | 0.006264 | 20.8M |
Metrics Over Time
Combined target variant (multiple fields predicted jointly).
Pressure
SATURATION
Paper Metrics Comparison
Metrics from the shared paper-metric module (utils/paper_metrics.py) evaluated on the held-out test split. Loss column distinguishes the training recipe; lower is better.
Targetpressure
| # | Model | Loss | Epochs | pressure_mre_t1▲ | pressure_mre_t2 | pressure_mre_pinit |
|---|---|---|---|---|---|---|
| 1 | UNet2D | BadawiSingleField | 500 | 2.3318 | 1.5035 | 1.0500 |
| 2 | UNet2D | RelLp | 200 | 3.6178 | 2.2448 | 1.5844 |
| 3 | UNet3D | BadawiSingleField | 200 | 3.9058 | 2.3524 | 1.4141 |
| 4 | UNet2D | RelLp | 200 | 4.0520 | 2.4500 | 1.7881 |
| 5 | FNO3D | BadawiSingleField | 200 | 4.0974 | 2.4501 | 1.7183 |
| 6 | SwinUNETR2D | RelLp | 200 | 5.0611 | 2.8580 | 2.0847 |
| 7 | SegResNet2D | RelLp | 200 | 5.4172 | 3.1093 | 2.3818 |
| 8 | SegResNet2D | RelLp | 200 | 5.8811 | 3.6437 | 2.5931 |
| 9 | FNO2D | RelLp | 200 | 6.1346 | 4.0560 | 2.9461 |
| 10 | FNO2D | RelLp | 200 | 6.1515 | 4.1231 | 3.0577 |
| 11 | SwinUNETR2D | RelLp | 200 | 6.4532 | 3.6039 | 2.6792 |
Targetsaturation
| # | Model | Loss | Epochs | saturation_mape▲ |
|---|---|---|---|---|
| 1 | UNet3D | BadawiSingleField | 200 | 0.4538 |
| 2 | UNet2D | RelLp | 200 | 0.5251 |
| 3 | UNet2D | BadawiSingleField | 500 | 0.5556 |
| 4 | UNet2D | RelLp | 200 | 0.5643 |
| 5 | SegResNet2D | RelLp | 200 | 0.9187 |
| 6 | SegResNet2D | RelLp | 200 | 0.9312 |
| 7 | FNO2D | RelLp | 200 | 0.9649 |
| 8 | FNO3D | BadawiSingleField | 200 | 1.0690 |
| 9 | FNO2D | RelLp | 200 | 1.0787 |
| 10 | SwinUNETR2D | RelLp | 200 | 1.3254 |
| 11 | SwinUNETR2D | RelLp | 200 | 1.3373 |
Targetcombined
| # | Model | Loss | Epochs | pressure_mre_t1▲ | pressure_mre_t2 | pressure_mre_pinit | saturation_mape |
|---|---|---|---|---|---|---|---|
| 1 | UNet3D | BadawiCombined | 2000 | 1.2283 | 0.7430 | 0.4767 | 0.3379 |
| 2 | UNet2D | BadawiCombined | 4000 | 1.4780 | 0.9605 | 0.6796 | 0.3534 |
| 3 | UNet2D | BadawiCombined | 4000 | 1.5575 | 1.0099 | 0.7122 | 0.3601 |
| 4 | UNet2D | BadawiCombined | 4000 | 1.7451 | 1.1384 | 0.7880 | 0.3681 |
| 5 | UNet3D | BadawiCombined | 200 | 1.7478 | 0.9876 | 0.7255 | 0.5377 |
| 6 | UNet2D | BadawiCombined | 500 | 1.9249 | 1.2279 | 0.8232 | 0.4441 |
| 7 | UNet2D | RelLp | 200 | 2.9759 | 1.7088 | 1.1383 | 0.4817 |
| 8 | UNet2D | RelLp | 200 | 3.1777 | 1.9051 | 1.4981 | 0.4735 |
| 9 | SegResNet2D | RelLp | 200 | 4.7285 | 2.6187 | 1.8788 | 0.8947 |
| 10 | FNO2D | RelLp | 200 | 4.7444 | 2.9138 | 2.1565 | 0.8582 |
| 11 | FNO3D | BadawiCombined | 200 | 5.4209 | 2.7622 | 2.0342 | 1.0553 |
| 12 | FNO2D | RelLp | 200 | 5.5917 | 3.6936 | 2.8783 | 0.9702 |
| 13 | SegResNet2D | RelLp | 200 | 6.4500 | 3.3794 | 2.4770 | 0.9206 |
| 14 | SwinUNETR2D | RelLp | 200 | 6.5326 | 3.6978 | 2.6592 | 1.5224 |
| 15 | SwinUNETR2D | RelLp | 200 | 7.3336 | 3.8777 | 2.7251 | 1.4949 |
About This Benchmark
This benchmark is based on the dataset introduced by Badawi & Gildin (2024), featuring two-phase (oil-water) immiscible flow simulations on a 40x40 Cartesian grid. The simulations are generated using CMG IMEX, a commercial black-oil simulator.
Each simulation spans 10 years with a reporting interval of approximately 0.5 days, producing 366 raw snapshots. These are windowed into 40-timestep sequences for training. The geological models feature heterogeneous permeability fields with varying well counts (3-11 wells) and placements.
The training set comprises 3500 simulations augmented 4x via geometric flips (horizontal, vertical, and combined), yielding 14000 effective training samples. Validation uses 500 simulations and testing uses 200 simulations. Importantly, the test set contains out-of-distribution well configurations not seen during training, testing the model's ability to generalize to novel operational scenarios.
Input features include: log-normalized permeability, producer bottom-hole pressure (BHP), injector rate, binary well location masks, initial pressure, and initial water saturation — 6 channels total.
We also compare against the APT (Approximate Physics Transformer) method from arXiv 2602.11208, which reports delta_p (pressure relative error) and delta_sw (saturation relative error) metrics.
Dataset details
- train
- 3500
- train augmented
- 14000
- val
- 500
- test
- 200
- augmentation
- 4x geometric flips (horizontal, vertical, combined)
- test note
- Out-of-distribution well configurations (3-11 wells)
Input features
Paper metrics explained
Training Configuration
Configuration for the best-performing model (UNet3D).